From the World
Bank files:
| Figure 3 Factors associated with corruption |
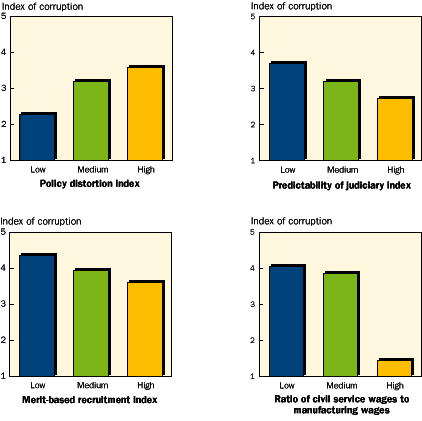 |
| Note: Each index score is the average for
a group of countries. See the Technical Note for details and definitions of the indexes.
Higher values of the corruption index mean more corruption, and similarly for the other
variables. The top left panel is based on a simple correlation for thirty-nine industrial
and developing countries during 198493 (for the policy distortion index) and 1996 (for
the corruption index). The top right panel is based on a regression using data from
fifty-nine industrial and developing countries during 1996. The bottom left panel is based
on a regression using data for thirty-five developing countries during 197090. The
bottom right panel is based on a simple correlation for twenty industrial and developing
countries in the late 1980s to the early 1990s; wage data are means. Source: World Bank
staff calculations. |
Summary |