|
II. RECENT TRENDS IN ASIAN SHRIMP PRODUCTION
Only fifteen years ago nearly all commercialized shrimp were captured from
the oceans. Capture of wild ocean shrimp tended to become more seasonal and unpredictable
during the second half of the 1980s. In several Asian coastal zones, shrimp were also
cultivated for local consumption in traditional bheri multicropping aquaculture
systems during the dry season in intertidal areas. Brackish estuarine water was allowed to
flow into croplands bringing with it crustacean and fish fry which would feed and grow on
naturally available plankton and other vegetation. Also, traditional salt makers often
used their ponds to cultivate fish and prawns during the rainy season (Sultana, 1994). By
1993, close to 30 per cent of world shrimp production came from monocropping extensive,
semi-intensive and intensive aquaculture. It is estimated that by the year 2000 cultured
shrimp will surpass harvested shrimp production (Maw Cheng Yang, cited by Rosenberry,
1993:34).
While there are several hundreds of classified shrimp species, Asian
shrimp and prawn farming concerns only about eight warm-sea or brackish water species.
About 60 per cent of Asian farmed shrimp production is from the black tiger shrimp (Penaeus
monodon) or gambas, about another 25 per cent from the fleshy prawn (Penaeus
chinensis), and the remainder is mainly shared by the banana shrimp (Penaeus
merguiensis) and in minor proportions by four or five other species (Csavas, 1992;
Rosenberry, 1994b). Shrimp culture has been long dependent on wild seed stocks, be it by
collecting fry in shallow estuaries or by capturing live gravid females. More recently
— as wild stocks are depleting and reproduction is not feasible by shrimp confined in
ponds — hatcheries are being built to produce post-larvae more intensively from
artificially fertilized mature female prawns whose eyes are cut to induce their spawning[4].
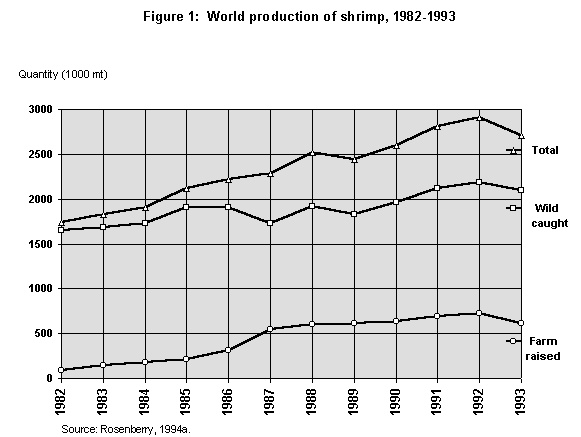
Globally, production of farmed shrimp increased exponentially from about
200,000 metric tons in 1985 to exceed 630,000 metric tons in 1990. Then the growth rate
slowed down. World production climbed to an estimated 721,000 metric tons in 1992 but in
1993 it fell back to about 610,000 metric tons (see table 1). In 1994, world production
was estimated to be 733,000 metric tons[5]. (Rosenberry,
1994a:47). Production estimates from different sources vary substantially: for example,
according to FAO, total farm-raised shrimp and prawn production in 1992 was 884,075 metric
tons — 23 per cent more than estimated in table 1 (FAO, 1994).
Estimates of the monetary values generated by farmed shrimp production
vary widely depending on the prices and volumes assumed and the link in the production
chain at which they are calculated. World production as it leaves the shrimp farms was
estimated at US$ 3.4 billion in 1993, by one source (Produits de la Mer, 1994:83).
Assuming an average producer price of US$ 4 per kilogram[6], 1994 production of 733,000 tons would have a monetary
value at the farm level of about US$ 3 billion using Rosenberry's production estimates.
Prices of shrimp landed in importing countries were worth about US$ 6 billion, about
double producer prices. Indeed, the United States importing firms in 1994 paid some US$
5.50 per pound or about US$ 11 per kilogram of shrimp (Filose, 1995:231). If 80 per cent
of worldwide cultivated shrimp were exported, and if import prices were for
"heads-off" shrimp, this implies a considerably smaller volume than that
estimated for total heads-on production. Accordingly we reduced the overall volume of
produced live shrimp from 733,000 tons to 550,000 tons of traded shrimp; the average
shrimp market value as an imported commodity would then be about US$ 6 billion for 1994.[7] A large share of value added within the importing
countries goes to distributors, retailers and food industries which mark up the product
(cost, insurance and freight included) by between 30 and 50 per cent (INFOFISH, 1991:63),
raising the global retail market value of farmed shrimp to a conservative estimate of US$
7.8 billion. These estimates do not account for price variations of imported shrimp
between Japan, the United States and Europe (see figure 4, page 23), which show that
Japanese were paying the most per kilogram of imported shrimp. Also, these estimates
exclude other world importers — middle and upper classes from Asian countries in
particular are becoming, in general, great shrimp consumers — and earnings accruing
from domestic markets (China alone consumed 100,000 tons of farm-raised shrimp in 1993
— Rosenberry, 1993:52). Overall the retail market value of cultivated shrimp is well
over US$ 8 billion.
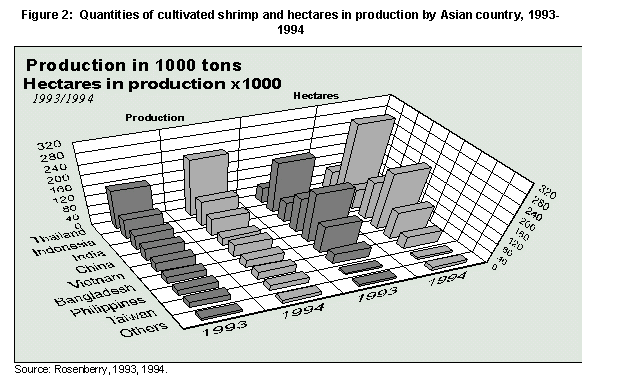
About 80 per cent of world cultured shrimp come from Asia. Between 1993
and 1994 Asia has increased its production from 477,000 metric tons (heads-on) to 585,000
metric tons, with an increase in area of about 170,000 hectares to reach a total exceeding
one million hectares (Rosenberry, 1993 and 1994a). The decline in production in 1993 was
largely due to disease outbreaks damaging two thirds of the Chinese shrimp crop and also
affecting many Indonesian and Ecuadorian shrimp farms. The main reasons for the disease
outbreak were polluted waters, dense use of coastal areas for semi-intensive and intensive
production and fragile shrimp due to over-medication and overstocking. China's production
difficulties continued in 1994, but overall Asian production increased between 1993 and
1994 by about 20 per cent (Rosenberry, 1994a).
_______________________________________________
Table 1: World production of shrimp, 1982-1994
|
|
Thousands of metric |
tons |
Year |
Farm-raised |
Wild-caught |
Total |
1982 |
84 |
1,652 |
1,736 |
1983 |
143 |
1,683 |
1,826 |
1984 |
174 |
1,733 |
1,907 |
1985 |
213 |
1,908 |
2,121 |
1986 |
309 |
1,909 |
2,218 |
1987 |
551 |
1,733 |
2,284 |
1988 |
604 |
1,914 |
2,518 |
1089 |
611 |
1,832 |
2,443 |
1990 |
633 |
1,968 |
2,601 |
1991 |
690 |
2,118 |
2,808 |
1992 |
721 |
2,191 |
2,912 |
1993 |
610 |
2,100 |
2,710* |
1994 |
733 |
- |
- |
Source: Peckham, in Rosenberry, 1994a: 47.
* The FAO Yearbook of Fishery Statistics, 1994 estimates worldwide
nominal catches for 1993 — including cultivated shrimp — at 2,892,927 metric
tons.
Shrimp aquaculture production varies widely from year to year and from
place to place principally because it is particularly sensitive to disease outbreaks.
Before its industry collapsed due to disease in 1988, Taiwan Province of China was the
world's largest producer. In the early 1990s China, followed by Thailand, Ecuador,
Indonesia, Viet Nam, the Philippines, India and Bangladesh were the most important
producers globally (see table 2). Very high densities of shrimp cultivation were reached
in some coastal areas of these countries. In 1993 the abrupt drop in China's production
left Thailand as the world's largest producer. Thailand has developed part of its Inner
Gulf area with shrimp ponds at the incredible density of about 100 hectares of ponds per
kilometre of coastline (Csavas, 1994a:figure 13). From 1993 to 1994, Thailand expanded its
pond area for shrimp aquaculture from 60,000 hectares to 80,000 hectares. Most of the Thai
production (85 per cent) comes from intensive farms with ponds from 0.5 to 5 hectares each
(Rosenberry, 1993 and 1994a).
The progression of cultured shrimp production has been facilitated both by
evolving technologies and expanding pond areas. Customary production systems are being
replaced by more intensive ones. This has been encouraged by increasing demand from high
income countries, together with governmental and lending agency support and subsidies.
Shrimp yields per hectare in many areas increased within a few years from an average of
100 kilograms per hectare per crop to an average of about 1,000 kilograms per hectare per
crop for semi-intensive shrimp farms, and to between 2,000 and 10,000 kilograms per
hectare per crop for intensive forms of production. There can be from two to three crops
per year for semi-intensive and intensive types of shrimp farming. Yields beyond 8,000
kilograms per hectare per year, however, involve high risks of heavy shrimp mortality due
to overstocking and self-pollution (Hirasawa, 1992). Water in intensive ponds has to be
exchanged more frequently, in order to supply clean water and dissolved oxygen necessary
for the growth of the shrimp. Asian-wide average pond productivity per hectare per year
increased from 563 kilograms annually in 1993 to 575 kilograms in 1994. Intensification
still includes a minority of shrimp farms in most Asian countries and production increases
are in part due to the increase of pond area for all types of farms taken together.
_______________________________________________
Table 2: World shrimp farming statistics by region and by country,
1993-1994
|
% of
production by
hemisphere |
Tons of heads-on
production
(1,000 t) |
Hectares in
production
('000 ha) |
Kilograms
per hectare
(kg/ha/yr) |
| Ecuador |
68 68 |
90 100 |
90 90 |
1,000 1,111 |
| Colombia |
7 7 |
9 10 |
3 3 |
3,333 3,846 |
| Honduras |
7 7 |
9 10 |
8 11 |
1,125 909 |
| Mexico |
7 8 |
9 12 |
8 12 |
1,125 1,000 |
| United States |
2 1 |
3 2 |
1 1 |
3,333 2,887 |
| Others |
9 9 |
12 14 |
6 13 |
2,000 --- |
| Western Hemisphere |
100 100 |
132 148 |
116 130 |
1,142 1,136 |
|
|
|
|
|
| Thailand |
32 39 |
155 225 |
60 80 |
2,583 2,813 |
| Indonesia |
17 17 |
80 100 |
200 300 |
400 333 |
| India |
13 12 |
60 70 |
80 80 |
750 875 |
| China |
11 6 |
50 35 |
140 150 |
357 233 |
| Vietnam |
8 9 |
40 50 |
200 225 |
200 222 |
| Bangladesh |
6 6 |
30 35 |
110 110 |
273 318 |
| Philippines |
5 5 |
25 30 |
40 50 |
625 600 |
| Taiwan |
5 4 |
25 25 |
7 7 |
3,571 3,571 |
| Others |
2 2 |
12 15 |
10 15 |
1,200 1,000 |
| Eastern Hemisphere |
100 100 |
477 585 |
847 1,017 |
563 575 |
Source: NAGA, the ICLARM Quarterly, 1994:30;
Rosenberry, 1993 and 1994b:3 and 14.
Extensive farms can flood over 100 hectares; although they are commonly
much smaller; intensive and semi-intensive ponds vary from less than 0.5 hectares to about
5 hectares. Semi-intensive farms for the most part use minimal external inputs and rely on
the capture of wild shrimp fry and only occasional feeding. Intensive ones use hatchery
raised post larvae, pellets of mixed feeds, chemical fertilizers, medication, etc. Feed
costs average 50 per cent of production costs for intensive and semi-intensive farms
reaching over two thirds of current operating costs for some intensive farms. Shrimp are
fed four to five times per day. In 1994 feed mills worldwide produced one million metric
tons of shrimp feed. Feed manufacture requires considerable inputs of commercial energy
and sophisticated technology in order to produce nutritious and physically stable pellets.
Even the best pellets, however, lose about 20 per cent of their protein and most of their
other nutrients within one hour of being immersed in the ponds (Rosenberry, 1994a:42-44).
While labour input is relatively low, the energy costs of more intensive forms of shrimp
production are high. Commercial energy inputs include the production of nutrients, feed,
veterinary and sanitary products; the pumping and aeration of water[8]; the production and use of automated feeding and
harvesting devices; the raising of shrimp larvae in hatcheries; the freezing, packaging,
storing and transporting the product to distant consumers.
Different farming systems vary greatly in the amount and rate of exchange
of pond water as well as in the salinity of the water that is used. Optimal growth of
shrimp is believed to occur in a salinity one third below that of average sea-water salt
content, as this favours phytoplancton beneficial to the growth of the shrimp. On the
other hand, sea-water is less inclined to become infested with pathogens. Fresh-water from
irrigation channels is also often loaded with harmful nutrients and chemicals (shrimp
farms being at the tail end of irrigation systems). If the fresh-water is pumped from
underground wells it often causes a fall of water tables, and may thus result in the
salinization of fresh-water aquifers. Many Thai farms, however, pump in only sea-water
(with an average daily exchange of 20 to 30 per cent) in order to bring in natural foods
(compensating for lesser growth of phytoplancton). This sea-water based system also uses
sea-water reservoir ponds that accumulate water from high tides and allow sedimentation,
temperature elevation, and some phytoplancton growth before the water is introduced into
grow-out ponds. In semi-intensive systems (with a water depth of about one metre) the pond
water is exchanged at a rate varying between 50 per cent per week and 30 per cent per day,
using natural tidal flows or pumping. Intensive shrimp production (with ponds from one to
three metres deep for super-intensive farms) requires a change of about 30 per cent of
pond water per day and up to 50 per cent for super-intensive systems (Kongkeo, 1990:table
3). Systems using large quantities of fresh-water tend to be particularly vulnerable
because high-quality water is becoming a scarce resource nearly everywhere.
The environmental and social implications of the rapid expansion of
intensive shrimp aquaculture are staggering. Thailand has about 2,600 kilometres of
coastline (Csavas, 1994b), and less than half of this is on its Inner Gulf. If its 80,000
hectares of ponds (85 per cent of which are intensive) were spread evenly along its entire
coast, there would be a continuous belt of ponds some 300 metres wide. Of course, this is
not the case as in some areas ponds penetrate several kilometres inland, but even so,
large areas of its coastline are entirely occupied by intensive shrimp farms. According to
the literature reviewed, intensive ponds have a maximum life of only five to ten years
(Boromthanarat, 1994). Abandoned ponds can no longer be used for shrimp and there are few
known alternative uses for them except some other types of aquaculture. Apparently they
can seldom be economically rehabilitated for other uses such as cropland. If these
assertions are accurate, within a decade or two there would be practically no mangroves,
salt marshes or agricultural lands that were usable left in the coastal margins of the
country, assuming it continues production near present levels.[9]
The situation in Bangladesh could become even more dramatic. The country
has 700 kilometres of coastline and is estimated to have 110,000 hectares of shrimp ponds.
At present, these ponds are nearly all extensive. Even though many traditional users are
losing access to some of their resources, there has been less environmental damage
associated with extensive than with semi-intensive or intensive shrimp farms. If these
ponds were evenly spread along the coastline, it would imply a continuous belt over 1.5
kilometres wide. If these extensive ponds are turned into intensively managed farms, the
ecological and social impacts will be even greater. Future generations may have a very
heavy burden to bear as a consequence of intensive shrimp farming in these countries.
Footnotes
4. In natural conditions, shrimp move through
about ten habitats during their life cycle. Mature shrimp breed at sea on reefs, larval
and juvenile shrimp grow in mangroves to go then further upstream into low medium salinity
reaches, before going back to the estuary and reefs to spawn (Ibrahim, 1995).
5. These production quantities are estimated for
live heads-on shrimp.
6. Production costs at farm level vary widely
— from US$ 1 to US$ 8 per kilogram of live shrimp — according to the price of
the land and labour and the degree of intensity of production (Rosenberry, 1994a:40). We
assumed an average production cost at farm level, including return on capital, of US$ 4
per kilogram of live shrimp.
7. FAO's estimate of the global value of cultured
shrimp for 1992 comes to US$ 6 billion (New et al., 1995:15).
8. Keeping water oxygen levels at 6-9 milligrams
per litre (Ibrahim, 1995).
9. Taiwan Province of China, the world's largest
producer in 1988 with 10,000 hectares of ponds, had only 7,000 hectares of ponds in
operation in 1993. Further research should be carried out on what has happened to its
abandoned ponds and on what the ecological implications have been. |