| |
|
The political economy of development |
|
| Home- Themes- Reports- Statistics/Search- Lecture notes/News- People's Century- Puro Chile- Mapuche |
| Make your work easier and more efficient installing the rrojasdatabank toolbar ( you can customize it ) in your browser. |
|
| Reproduced from the United Nations Food and
Agriculture Organization website
The State of Food and Agriculture 1998 PART IWORLD REVIEWI. RECENT DEVELOPMENTS IN WORLD FOOD SECURITYContinuing the approach initiated in The State of Food and Agriculture 1997,
this section presents an overview of the current world food security situation by region
and by country. It provides the most recent FAO estimates of the number of undernourished
people and their proportion in the population of their region and country; the
relationship between income levels and trends, and the levels and composition of dietary
energy supply (DES) and undernourishment; and a number of selected indicators relating to
undernourishment1 in defined country categories. CURRENT SITUATIONThe total number of chronically undernourished people in developing countries is now estimated to be 828 million for the 1994-96 period (Table 1). This figure represents a slight decline in the proportion of undernourished since the early 1990s, but also a slight absolute increase because of the growth in total population and the changes in age composition which lead to changes in minimum dietary requirements.2
|
||||||||||||||||||||||||||||||||||||||||||||||||||||||||||||||||||||||||||||||||||||||||||||||||||||||||||||||||||||||||||||
| Region | Percentage of
population |
Number of
undernourished |
||
1990-92 |
1994-96 |
1990-92 |
1994-96 |
|
| Sub-Saharan Africa | 40 |
39 |
196 |
210 |
| Near East and North Africa | 11 |
12 |
34 |
42 |
| East and Southeast Asia | 17 |
15 |
289 |
258 |
| South Asia | 21 |
15 |
237 |
254 |
| Latin America and Caribbean | 15 |
13 |
64 |
63 |
| All developing regions | 20 |
19 |
822 |
828 |
Note: Owing to the omission of Oceania, numbers
do not add up to the total.
Source: FAO.
Table 1 confirms that the largest absolute numbers of undernourished people are in Asia, while the largest proportion of the population that is undernourished is in sub-Saharan Africa. Recent trends give no room for complacency, as progress in some regions has been more than offset by a deterioration in others. It has repeatedly been stated that these numbers are unacceptably high and must be drastically reduced. The World Food Summit Plan of Action is being implemented with the aim of halving the total number of undernourished no later than 2015.
SHARE OF FOOD GROUPS IN DIETARY ENERGY SUPPLY
BY REGION AND COUNTRY GROUPS
Per caput dietary energy supply, the most important single indicator underlying estimates of food adequacy levels, measures the food available to each person on average in a country. It is measured in kilocalories (kcal) per day. Map 1 shows the average DES of each country in the world and illustrates some of the variations within regions that are hidden by the regional aggregation in Table 1. Countries with an inadequate food supply – which are generally those with a higher proportion of undernourished people – are heavily concentrated in sub-Saharan Africa, with a relatively high number also in South and Southeast Asia.
In addition to kcal per caput, DES and food security are measured by access to a healthy and balanced diet. Figure 1 shows geographical differences in the composition of DES in the world. The differences are apparent from one region to another and are even more striking when the countries are grouped according to the level of economic development. Such differences are due to varying capacities to purchase food – people in richer countries can afford more livestock products and fats – and to the different availability of foods among countries. In general, the diets of richer countries seem to be more balanced nutritionally and also contain a greater proportion of protein, particularly of animal origin, than those of the poorer countries. Developing countries’ diets are characterized by a high proportion of cereals. However, even at similar income levels, there are significant variations in diet among countries, reflecting differing production capabilities, access to food and tastes.
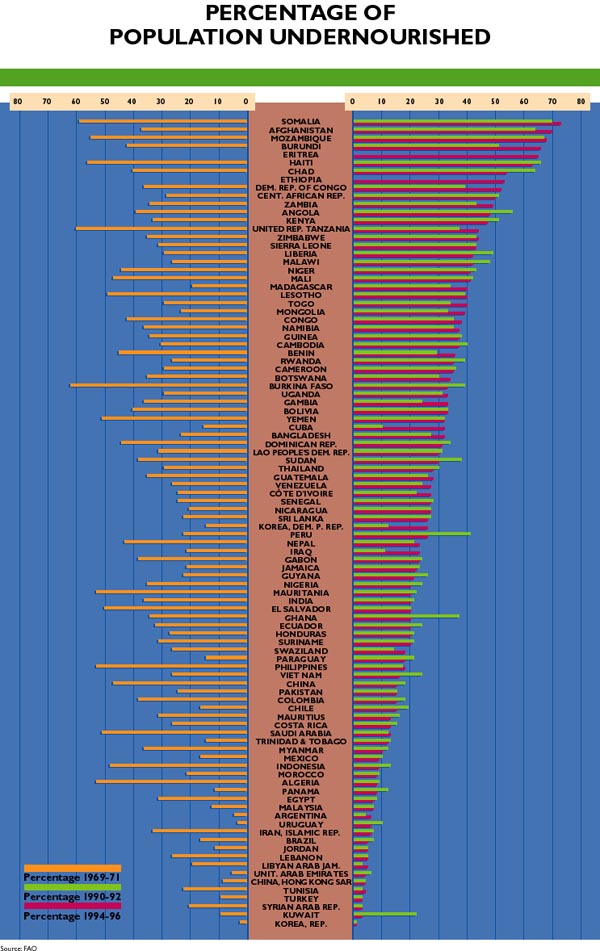
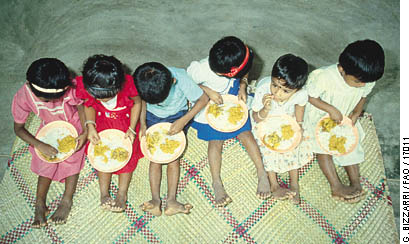
PERCENTAGE OF POPULATION UNDERNOURISHED
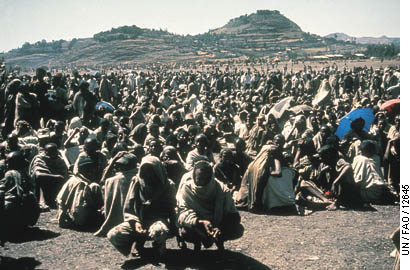
Drought-affected people
Drought can cause loss of crops and food availability
Figure 2 (presented in poster format in the inside back flap of this publication) shows recent changes in undernourishment in individual countries compared with their situation 25 years ago. The percentage of undernourished declined in the majority of countries in all regions, while a few countries experienced substantial increases owing to exceptional circumstances in the early 1990s.
In the entire subregion, almost half the countries experienced increases in the proportion of undernourished between 1990-92 and 1994-96. However, in many countries with fast-growing populations, even a lower proportion of undernourished translates into higher absolute numbers.
In both Asia and the Near East and North Africa, more than two-thirds of the countries achieved a decrease in undernourishment (in percentage terms) between 1990-92 and 1994-96. Only three out of 24 countries in the Latin America and Caribbean region show increase the proportion of undernourished during the same period.
The poorest group of countries has not been able to reduce the number or percentage of undernouris hed since 1969-71.
One important aspect of undernourishment is its close association with people’s financial capacity to purchase food. Figure 3 illustrates this aspect, showing four groups of countries, ranked by per caput income level in 1995, and the changes in both undernourished populations and per caput DES for the three periods 1969-71, 1990-92 and 1994-96. As expected, countries with a higher per caput income are those with a higher DES level and a lower proportion of undernourished in their population. More striking, however, is the fact that, contrary to the overall tendency in the developing countries as a whole, the poorest group of countries has not been able to reduce the number or percentage of undernourished since 1969-71.
Certain indicators are important in understanding past trends, and perhaps suggesting future trends, in the undernourished population. As indicators, they can be looked to for insights into the presence of undernourishment in a country or region, but they do not fully explain or predict it. This section discusses the relationship between selected indicators and undernourishment.
In order to highlight patterns better, 98 developing countries (comprising 96 percent of the population in the developing world) have been grouped into six categories according to the proportion of undernourished in the population in 1990-92. The percentage of undernourished in the population is more than 50 percent in Class 1 and declines to less than 10 percent in Class 6. Tables 2 and 3 show eight indicators corresponding to the six country groupings. Each indicator is discussed briefly in terms of how it relates to the proportion of undernourished in the country groupings.3
Income distribution and ease of access to food have a major influence on a country’s food insecurity situation.
Table 2 shows that developing countries with a high proportion of undernourished tend to have the lowest income levels, while those with a low proportion of undernourished have relatively high incomes. Almost all the countries (34 of 37) in Classes 1 to 3 are below the low-income threshold of $765 per caput per annum (1995).
| Country groupings (by % of undernourished in 1990-92) |
Number of |
Population |
Per caput |
Share of rural |
Share of |
Net food |
| Class 1. > 50% | 11 |
124 |
100-340 |
61-87 |
33-56 |
239 |
| Class 2. 40-50% | 10 |
126 |
180-800 |
42-87 |
15-42 |
314 |
| Class 3. 30-40% | 16 |
400 |
120-1 460 |
40-82 |
10-50 |
158 |
| Class 4. 20-30% | 25 |
1 216 |
240-3 490 |
14-79 |
5-51 |
-5 |
| Class 5. 10-20% | 17 |
1 631 |
620-7 040 |
21-73 |
0-26 |
172 |
| Class 6. < 10% | 19 |
606 |
1 120-17 400 |
10-47 |
6-20 |
464 |
1 World Bank data.
2 Negative
figures indicate net food exports.
Note: Number of countries in each class:
Class 1: 11 (9 Africa; 1 Asia and Pacific; 1 Latin America and
Caribbean; 0 Near East and North Africa)
Class 2: 10 (8 Africa; 0 Asia and Pacific; 2 Latin America and
Caribbean; 0 Near East and North Africa)
Class 3: 16 (13 Africa; 2 Asia and Pacific; 1 Latin America and
Caribbean; 0 Near East and North Africa)
Class 4: 25 (7 Africa; 8 Asia and Pacific; 8 Latin America and
Caribbean; 2 Near East and North Africa)
Class 5: 17 (2 Africa; 5 Asia and Pacific; 7 Latin America and
Caribbean; 3 Near East and North Africa)
Class 6: 19 (0 Africa; 4 Asia and Pacific; 5 Latin America and
Caribbean; 10 Near East and North Africa)
| Country groupings (by % of undernourished) |
Per caput GNP |
Net agicultural |
Staple food |
Food price inflation |
| Class 1. > 50% | 0 7 2 |
1 5 3 |
9 0 2 |
1 5 0 |
| Class 2. 40-50% | 3 5 2 |
2 3 3 |
6 1 3 |
0 7 1 |
| Class 3. 30-40% | 5 5 6 |
3 10 3 |
14 0 2 |
0 11 0 |
| Class 4. 20-30% | 10 7 4 |
3 9 8 |
19 0 6 |
0 18 0 |
| Class 5. 10-20% | 13 1 2 |
4 6 7 |
11 1 5 |
1 13 0 |
| Class 6. < 10% | 9 1 5 |
4 4 10 |
13 3 3 |
0 10 1 |
Note: + = positive; 0 = negligible; - = negative.
Conversely, almost all the countries (28 of 31) in Classes 5 and 6 are above the low-income threshold. The range of income is fairly wide in each country class, however. Class 4 (consisting of 25 countries) is the most heterogeneous, including several countries with a per caput GNP below $300 and several others with a per caput GNP of more than $3 000 per annum. This demonstrates that other factors, such as income distribution, ease of access to food and other indicators discussed below, have a major influence on the food insecurity situation in a country regardless of the average level of income.
There is a complex relationship between the prevalence of undernourishment and the agricultural/rural character of an economy.
The dependence of a country’s economy on agriculture is a significant factor in food security. This is shown in two ways in Table 2: by the proportion of rural population4 and the share of agriculture in GDP. Developing countries are generally largely rural and heavily dependent on agriculture, especially those with a high prevalence of undernourishment. All of Classes 1 to 5 contain countries where 70 percent or more of the population is rural. Classes 1 to 4 include countries with a high share of agriculture in GDP. The data demonstrate, however, that the relationship between the prevalence of undernourishment and the agricultural/rural character of an economy is complex. In all classes, a fairly broad range of dependence on agriculture prevails, as measured by either indicator, although the upper and lower ends of each range do fall as the proportion of undernourished falls.
Food import dependence is measured as net food imports in terms of kcal per caput per day (see Table 2). Only one-quarter of countries have either a surplus or an approximate balance. Balance is defined as a surplus or deficit of less than 100 kcal per caput per day, i.e. 5 percent or less of per caput food availability.
For the food-deficit countries, which are the large majority, it is worth observing that a greater prevalence of high food deficits is found in classes with lower proportions of undernourished people; indeed, large food import volumes are generally associated with a higher per caput GNP and greater purchasing power.
Four different indicators are presented in Table 3 in order to demonstrate the effects of certain economic trends on the proportion of undernourishment in countries.
A high proportion of undernourished can be a handicap for economic development.
Per caput GNP growth reflects the economic conditions over the relevant period in each country and is closely related to the proportion of undernourished in the countries. In the group of 87, per caput GNP rose between 1985 and 1995 for 40 of these countries, declined in 21 and remained about the same in 26. All countries in Class 1 had a negligible or negative per caput income growth in the decade considered; two-thirds of countries in Classes 2 and 3 had a negligible or negative growth; in Class 4, one-half of the countries experienced positive growth during the period; and Classes 5 and 6 contain predominantly countries with positive growth in per caput GNP. The hypothesis that a high proportion of undernourished can itself be a handicap for economic development may be supported by this observation and deserves further investigation.
The net agricultural trade surplus is mainly of significance for countries with a higher dependence on agriculture. The indicator does not appear to be closely related to undernourishment. Table 3 shows that, overall, two out of five of the countries reviewed have approximately balanced agricultural trade over the period 1985-95; one country out of five had a positive surplus and two out of five a negative one.
The goal of the World Food Summit is to halve the number of undernourished by 2015.
Staple food production grew between 1985 and 1995 in the majority of countries in all classes and declined in fewer than one-quarter of them. Trends in staple food production do not show a strong relationship with the undernourishment classes. The majority of countries in Classes 1 to 3, those with the greatest prevalence of undernourishment, have increased their staple food production during the decade considered.
Food price inflation, measured as the differential between food price changes and overall inflation over the period 1985-95, has also been examined. It shows that there has been no general drift in real domestic food prices, with very few cases of either positive or negative real food price trends. It should be noted, however, that a trend analysis conceals short-term price fluctuations and provides no basis for understanding the difficulties resulting from price instability.
The complexity of hunger in the developing world is illustrated by the wide range of conditions prevailing among countries with similar levels of undernourishment.
The conditions and trends described tell a complex and serious story about the millions of people who experience undernourishment in the developing world today. Their common story is hunger. The complex part of the story is illustrated by the wide range of conditions prevailing among countries with similar levels of undernourishment. It is reflected in the multiplicity of factors that must contribute to a steady increase in food supplies for those countries where aggregate food availability is not enough to meet the needs of all; and to a much improved access to food by the poor in most countries, including those where aggregate food availability is now sufficient but inequalities maintain a significant level of food insecurity among parts of their population. The evolution in the first half of the 1990s, prior to the World Food Summit, showed a mixture of progress and setbacks. The Summit target of reducing by half the number of undernourished people by 2015 calls for continued emergency action.
In future years, The State of Food and Agriculture will continue to present the latest
information available regarding food security conditions and the factors that can change
those conditions, keeping in view the target set during the World Food Summit.
![]()
![]()
![]()