| |
|
The political economy of development |
|
| Home- Themes- Reports- Statistics/Search- Lecture notes/News- People's Century- Puro Chile- Mapuche |
| Make your work easier and more efficient installing the rrojasdatabank toolbar ( you can customize it ) in your browser. |
|
| Reproduced from the United Nations Food and Agriculture Organization website
The State of Food and Agriculture 1998 PART IIREGIONAL REVIEWAfricaREGIONAL OVERVIEW
General economic performanceAfter four consecutive years of accelerating GDP growth, reaching 5.5 percent in 19961, the growth rate of Africa2 declined in 1997 to a more modest 3.2 percent. The International Monetary Fund (IMF) attributes the decline mainly to the adverse weather conditions affecting a number of countries as well as to a downturn in commodity prices and, in a few cases, to armed conflicts. The sharpness of the decline in economic expansion is to a large extent the consequence of a slowdown in economic activity in North Africa, which is particularly strong in Morocco but is also affecting Algeria and Tunisia.3In sub-Saharan Africa, the slowdown in GDP growth was somewhat more contained, falling from 4.9 percent in 1996 to a still relatively encouraging 4 percent in 1997. This was accompanied by a reduction in inflation rates in the majority of the countries in the subregion as well as a further narrowing of government fiscal deficits.
In spite of the slowdown in economic growth in the subregion as a whole in 1997, the trend still shows a significant improvement in economic performance since the early 1990s. The three years from 1995 to 1997 have indeed brought increases in per caput GDP for the first time in the 1990s. For the same period, the average annual per caput growth rate estimated by IMF corresponds to 1.8 percent, which compares with a rate of -1.2 percent over the 1990-94 period and -0.5 percent for 1981-89. In countries south of the Sahara, a large portion of the recorded decline in the rate of expansion of economic activity in 1997 was the result of a slowdown in South Africa, by far the largest economy in the subregion, where real GDP growth in 1997 fell to 1.7 percent from the 3.2 percent of the previous year, reflecting weakness in both domestic and external demand. According to IMF, South Africa is the only African country that has so far recorded any significant impact of the Southeast Asian crisis, as pressure on the currency led to a 4 percent depreciation of the rand in October 1997. In Nigeria, the other economic giant of the subregion, economic activity in 1997 accelerated for the third consecutive year, reaching a GDP growth rate of 5.1 percent. IMF, however, points to the hampering of economic activity by power and fuel shortages as well as the still unfavourable investment climate, and it projects a sharp slowdown in GDP growth in 1998.
Excluding the two major economies, South Africa and Nigeria, sub-Saharan Africa recorded a certain slowdown in growth in 1997 relative to the previous year as the rate of expansion of GDP slipped to 4.5 percent compared with 5.6 percent in 1996, although the momentum of the preceding years’ positive performances was maintained. In particular, the CFA franc-zone countries as a whole continued to show positive growth performances in 1997, with most of them recording growth rates above the average for the subregion and maintaining the momentum gained following the 1994 devaluation of the CFA franc. At the same time, consumer price inflation continued a downward trend, the sole exceptions being C¶te d’Ivoire and Togo. Inflation rates in all but one of the CFA countries are now well below the subregional average, indicating that inflation has been brought firmly under control since devaluation. Double-digit rates of inflation have only been recorded in Guinea-Bissau, which has just recently become a member of the West African Economic and Monetary Union (UEMOA)4 and adopted the CFA franc. In sub-Saharan Africa, IMF records accelerating rates of GDP growth in 1997 for 24 of the 45 countries for which estimates exist,5 decelerating rates in 17 countries and stable rates in three, while an actual decline in GDP is reported only for the Democratic Republic of the Congo. Rates of GDP growth, however, slowed in a number of the major countries of the subregion in 1997. This was the case for the two countries, among others, that had shown the most impressive growth performance of recent years – Ethiopia and Uganda. In Ethiopia, as growth in agricultural output slowed significantly because of unfavourable weather, GDP growth fell back to an estimated 5.3 percent following an expansion of 10.6 percent in 1996. In Uganda, GDP growth slowed to 5 percent compared with the rates of 8.1 percent in 1996 and 10.5 percent in 1995. Two other major countries of the sub-Saharan subregion, Ghana and Kenya, also recorded lower rates of GDP growth in 1997. On the other hand, in the Democratic Republic of the Congo, affected by civil conflict, the economic decline of the preceding years was not halted and GDP contracted by an estimated 5.7 percent. The United Republic of Tanzania maintained the estimated growth rate of 4.1 percent reached in 1996, while a particularly positive performance in 1997 was posted by the Sudan which, according to IMF estimates, managed to accelerate economic growth further to 5.5 percent from the 4.7 percent of 1996.
From its economic projections, IMF expects sub-Saharan Africa’s improved economic performance and prospects – chiefly attributed to improved macroeconomic policies and structural reforms – to continue in the coming years, thereby bringing further gains in per caput GDP. This outcome is, however, considered conditional on the continuation of rigorous macroeconomic policies and structural reforms. So far, with the exception of South Africa, the Asian crisis has not significantly affected African financial markets and IMF expects less of an impact than for other developing country regions because of the limited private capital flows. However, it does expect an impact on some African countries owing to the role of East Asian countries, and in particular Malaysia, as sources of foreign direct investment (FDI) and because of the higher cost of foreign borrowing. Specifically, for 1998 IMF projects economic activity in the subregion to expand at a rate of 4.1 percent, roughly that of 1997. Nigeria will, however, contribute significantly to pulling down the overall growth rate in 1998, as IMF forecasts a slowdown in GDP growth from 5.1 percent in 1997 to only 2.7 percent in 1998. In South Africa, also, GDP growth will remain below the average for the subregion, although accelerating to 2.2 percent, from 1.7 percent in 1997. Excluding the two major economies, for the remaining part of the sub-Saharan subregion GDP projections for 1998 appear to be more encouraging, as economic growth should accelerate to 5.2 percent from the 4.5 percent estimated for 1997. Again, the countries of the CFA zone appear set to record particularly promising growth performances, as the average GDP growth rate for this group in 1998 is projected at 6 percent, up from an estimated 5.5 percent in 1997. For 1999, IMF expects a further strengthening of economic growth, with the GDP growth rate rising to 4.8 percent for the sub-Saharan subregion and to 5.7 percent if Nigeria and South Africa are excluded. Among the major uncertainties in IMF’s economic growth projections for sub-Saharan
Africa are particularly important factors affecting agriculture. Possible adverse effects
of the El Ni±o phenomenon on agricultural production as well as the possibility of
declines in commodity prices could indeed lead to lower growth rates than those currently
projected for the subregion. Agricultural performancePoor agricultural performance, largely related to unfavourable weather conditions, was a major factor contributing to a certain slowdown in economic growth in sub-Saharan Africa in 1997, in spite of the still significant overall improvement in economic performance. Indeed, according to FAO’s current estimates of overall crop and livestock production (production index numbers), output in 1997 declined by 1 percent in the sub-Saharan subregion,6 constituting the first estimated decline in overall agricultural production since 1987. The drop represents a 3 to 4 percent contraction of per caput production, which follows four years of gradual expansion in per caput agricultural production. The percentage variation for food production is comparable, with production in 1997 having declined by an estimated 1.2 percent, corresponding to a 3.9 percent decline in per caput terms, while production of non-food agricultural products is estimated to have increased by 0.8 percent. If developed South Africa is included, the decline in crop and livestock production rises slightly to 1.4 percent as South African output is estimated to have declined by some 4 to 5 percent in 1997. The contraction recorded in agricultural production in 1997 is accounted for by an estimated reduction in crop production of 1.8 percent, with cereal production falling by as much as 3 percent. For livestock, although production is estimated to have increased by about 1 percent, this is nevertheless a slowdown relative to the previous four years. The pattern of production performances in 1997 differs widely across the continent with the negative performances largely linked to unfavourable weather conditions. The most siginificant declines were in southern Africa, where crop production was down sharply in a number of countries (Botswana, Lesotho, Malawi, South Africa, Swaziland and Zambia) owing to unfavourable weather. In East Africa, a severe drought at the beginning of the year substantially reduced second-season food production in Kenya, the United Republic of Tanzania, Uganda, Somalia and large parts of southern Ethiopia, while late or erratic rainfall later in the year led to reduced main season harvests in some countries, particularly in the United Republic of Tanzania and Uganda. In the Great Lakes region, dry weather in parts of Rwanda and Burundi, coupled with insecurity in conflict-affected areas, contributed to a slow recovery in food production. In West Africa, and particularly in Mauritania, crop production was severely affected by a prolonged mid-season dry spell.
When seen in a longer-term perspective, and even considering 1997 as a particularly negative crop year, agricultural production performances over the last five years indicate that, although expansion in production is now roughly keeping pace with the high rate of population growth in the subregion (see Figure 20), the agricultural sector can still not claim to have moved towards the level of expanding per caput output required in order to enhance the sector’s contribution to economic development and food security. Indeed, although FAO’s per caput agricultural production index for the subregion (excluding South Africa) stood at 100 at the beginning of the 1990s (average for the period 1989-91), by 1996 it had not moved beyond 101.7, after which it fell back to 97.6 in 1997. Similarly, for 1998, production prospects appear generally unfavourable owing to
the unpredictable El Ni±o-related weather conditions. In East Africa, excessive and heavy
rains starting in October 1997 resulted in extensive flooding, causing loss of human life
as well as substantial crop and livestock losses, and inflicted severe damage on the
subregion’s road and rail networks. In southern Africa, although the widespread
threat of El Ni±o-related drought has receded, erratic and excessive rains in part caused
localized crop losses. Developments in policies
In its assessment of the factors behind the improved overall economic performance
in sub-Saharan Africa during recent years, IMF clearly gives greatest importance to the
economic reforms that have been undertaken, and in which the agricultural sector has also
participated. During 1997 and early 1998 the main thrust of policy developments in the
subregion has continued to be towards increased market orientation of policies with
privatization or dismantling of state-owned interests in production and distribution,
while such policies are accompanied by increasing attention being paid to issues of
poverty alleviation and social needs. FIGURE 20In the field of privatization of state interests, numerous developments were recorded in a number of countries in the course of 1997 and early 1998. C¶te d’Ivoire is a country where particularly significant steps have been taken in the direction of privatization. In 1997, the privatization of the parastatal vegetable oil producer, Palmindustrie, was completed in June while privatization was scheduled to begin of the national cotton industry, Compagnie Ivoirienne pour le Dķveloppement des Textiles (CIDT), which has held a monopoly for cotton marketing. Previously privatized agro-industrial enterprises include the sugar-producing parastatal, Sociķtķ pour le Dķveloppement des Plantations de Canne Ó Sucre, l’Industrialisation et la Commercialisation du Sucre (SODESUCRE). Important developments can also be cited for other countries. In Botswana, a task force was set up to draft proposals for modalities of privatization of state-owned entities, including the Botswana Meat Commission. In Cameroon, recent privatizations include the national rubber company, while in 1998 privatization of the palm oil producer, Sociķtķ Camerounaise de Palmeraies (SOCAPALM), is under way. Other companies slated for privatization before 2000 include three other major agro-industrial companies: Cameroon Sugar Company, Inc. (CAMSUCO), Sociķtķ de Dķveloppment du Coton au Cameroun (SODECOTON) and the Cameroon Development Corporation, which has activities in the production of bananas, rubber, tea and oil palm and, with 13 000 employees, is the country’s largest employer (after the state). The Ethiopian Government is continuing its privatization programme with recent moves to sell off a textile enterprise as well as a number of state-owned tanneries. In Guinea-Bissau the government is implementing a privatization programme which will also affect parastatals in both the timber and the food processing industries. In Kenya, privatization through flotation of stock is planned of the largest national sugar producer, Mumias Sugar. Scheduled for privatization as part of the Lesotho Government’s privatization programme are the state-owned Lesotho Flour Mills, which had been set up as part of the previous government’s efforts to enhance food self-reliance. The previous monopoly position of the company, resulting from market and price controls, had already been eroded by policy reforms introduced in 1995 which had removed prior controls. In Malawi, recent privatization efforts include the listing of the national sugar-producing companies on the Malawi Stock Exchange. The Government of the Niger is reportedly committed to accelerating the privatization of a number of publicly owned companies, including the national textile company and agro-industrial companies operating in rice, meat and milk processing. Likewise, in Rwanda, privatization has gained momentum, affecting, inter alia, state-owned dairies and tea factories. In Senegal, the government is moving ahead with its efforts to sell off a 51 percent stake in the national groundnut processing company, Sociķtķ Nationale de Commercialisation des Olķogineux du Sķnķgal (SONACOS). In the United Republic of Tanzania, the main object of the government’s privatization efforts in 1997 has been the tea industry – the sale the Tanzanian Tea Authority’s tea factories is to be accompanied by efforts to develop the smallholder sector. In Zimbabwe, 1997 saw the flotation of the former Dairy Marketing Board, now Dairyboard Zimbabwe Limited. The next targets in the implementation of the government’s policy of privatizing the agricultural marketing parastatals were expected to be the former Cotton Marketing Board and the former Cold Storage Commission.
Liberalization of markets and trade is a field where significant reforms have already been undertaken by numerous African countries but where 1997 and early 1998 saw some further developments in a number of countries. In C¶te d’Ivoire, after having liberalized rice imports in January in 1997(and revised import tariffs so as to provide protection of domestic production), in June the government freed the domestic prices of sugar and locally produced tobacco products. The government reportedly plans to liberalize exports of coffee from 1998/99 and subsequently those of cocoa. In general, the government is moving towards reducing its intervention in agricultural production and marketing while at the same time promoting the creation of professional farmers’ associations with a view to representing farmers in the negotiation of producer prices and ensuring input supplies and technical assistance to farmers. In Madagascar, the gradual liberalization of agricultural trade culminated in May 1997 with the abolition of the vanilla export tax. Mozambique, in 1997, abolished administratively set minimum prices for food crops, while those for most cash crops are to be abolished in 1998. The country is also making efforts to eliminate administrative obstacles to foreign investors. The procedures for registration and the granting of trading licences to companies were to be simplified in 1997, a development that would also affect agricultural marketing. The Government of Nigeria decided to deregulate the fertilizer trade and remove the subsidy on fertilizers following several years of severe scarcity. In spite of the undoubtedly favourable impact on availability, concern was nevertheless expressed in the country about the cost of fertilizers to small-scale farmers. In South Africa, 1997 saw the gradual implementation of the Marketing of Agricultural Products Act, which was approved in September 1996 and entered into force in November the same year. The Act had set a 13-month timetable for the dismantling of state control over single-channel marketing boards which had previously controlled the marketing of a range of agricultural products. Among the last to abandon its monopoly position (towards the end of 1997) was the Wheat Board. The marketing activities of the boards are to be taken over by the private sector while efforts are being made to transform some of them into non-profit companies to ensure the continuation of some of the services previously provided by the boards, such as information dissemination. As a consequence of the liberalization of agricultural marketing, the only restrictions remaining on imports of agricultural products are import tariffs.
Poverty alleviation and improved social welfare are two objectives that are being specifically incorporated in African governments’ policy and are also explicitly included in programmes negotiated by African governments with IMF. Examples are Botswana, where 1997 saw the publication of a government study on the impact and alleviation of poverty in the country, and Burkina Faso, one of the lowest-ranking countries in UNDP’s human development index, where the government has set precise quantitative targets in the education and health sectors aimed at increasing primary school enrolment and the number of health centres. Similarly, for Mozambique, the economic programme for 1997/98 supported by IMF targets an increase in social expenditure to reduce poverty and emphasizes smallholder agricultural development to raise rural income levels. In the Niger, another country ranking very low on the human development index, in accordance with the IMF-supported programme the government is committed to undertaking family planning initiatives and programmes aimed at improving the quality of life for women. It is setting precise targets for increased school enrolment from 1996 to 1999 as well as increased budgetary expenditures for health and education from 1997 to 2000. Land tenure is another issue of priority concern for at least some of the African governments. In Eritrea, a new land law came into force in 1997. The law allows for Eritrean nationals and foreigners to lease land, while the responsibility for the allocation of land is moved from the municipalities to a new Ministry of Land, Water and Environment. Reportedly, in Malawi the government is considering major land reform with a view to improving the conditions of smallholders. Also in the pipeline in Senegal is a major land reform designed to give farmers ownership of their land, thus replacing the traditional tenure system. In South Africa, the government’s programme of land redistribution and assistance to small farmers is proceeding slowly. The objective of redistributing farmland to black farmers is not to be attained through expropriation but by using state-owned land and land repossessed from indebted white farmers.
African governments are increasingly concerned about the need to protect and regenerate national forest resources. In Burkina Faso, a major reforestation campaign was launched in July 1997. The campaign, which foresees the planting of 7 million trees in some of the more arid parts of the country, follows a similar three-year campaign from 1994 to 1997 during which 15 million trees were planted in areas threatened by desertification. The new campaign focuses on varieties that can also produce marketable products with a view to enhancing rural incomes. The Government of C¶te d’Ivoire, in 1996, banned all log exports with the exception of teak in an effort to put a brake on overexploitation of the forest resources and to promote domestic processing. The authorities are also reported to be facing difficulties in controlling illegal farming in protected forest areas. In Gabon, the government aims to process 50 percent of logged timber locally, and is reported to be considering fiscal reforms to stimulate investment in the sector. Madagascar’s native forests have already shrunk considerably, and concerns from the international community have led to debt-for-nature swaps. In Namibia, also, forest resources are threatened by illegal felling and export regulations were tightened in 1997 to help control the problem.
Experiences in institutional decentralizationEven prior to the current policy reforms undertaken in Africa, many governments had attempted to transfer decisional and operational functions to provincial or communal levels of public services, local and regional institutions and communities or civil society organizations. As in other continents, however, past experiences in this domain have not been universally successful. Unsolved problems that hindered better results have frequently been the absence or weakness of institutions necessary to support management capacity at the local level. Other difficulties include weak links between local and central administrations.7
Decentralization, however, appears to have gained momentum again, also owing to the changing political and economic environment. Indeed, advancement in democracy, increased market orientation of economic policies and the generalized adoption of stabilization and structural adjustment policies have contributed to creating an environment which is more conducive to institutional decentralization. In a country such as Ghana (see Box 5), institutional decentralization has indeed been
a major element of structural reform policies, also involving institutions with
responsibilities over rural development. In spite of some shortcomings that can be
overcome, this example points to the positive contribution to rural development that can
be expected from a strong commitment to participatory and decentralized rural development
approaches. UGANDAMAP 5OverviewAfter a long period of economic disaster, since 1986 Uganda has undergone a steady process of rehabilitation that has borne fruit. The fundamental economic indicators are greatly improved and social progress is a government priority. For the past ten years, real GDP growth has far surpassed the average rate of sub-Saharan African countries (6.4 percent per year in Uganda compared with an average of 1.6 percent in the remainder of sub-Saharan Africa) and per caput income has grown by almost 50 percent. Uganda is an extremely poor country with a population of 20 million people of diverse ethnic backgrounds. It is listed among the world’s poorest countries with a per caput GDP in 1996/97 of $301 (or $1 480 per year on a purchasing power basis). The population is growing at an annual rate of about 3.1 percent and, at 6.7 children per woman of child-bearing age, fertility rates are among the highest in the world. At 42 years, life expectancy is among the lowest in the world, and the disease of AIDS is widespread. In sum, the low level of income, high fertility rate and ominous health outlook create a daunting agenda for Uganda’s leaders. Uganda is located in the Great Lakes region of Africa, adjacent to Lake Victoria. It is a landlocked country containing 197 000 ha of rich land resources that are very favourable for agriculture. Uganda has few mineral resources, but has abundant savannah grassland, woodlands and bush. Compared with its neighbours, Uganda has a high population density, but is still 89 percent rural. The country is heavily dependent on agriculture as its economic mainstay, with the main products being subsistence food crops. The primary export is coffee. Uganda’s economy has demonstrated a steady improvement after being
completely shattered during the 1970s, but is still largely producing food crops, as many
people provide for their needs through subsistence farming. Current economic problems stem
from heavy rains in 1997 which cut back agricultural production and export earnings and
are causing domestic food price hikes. Economic historyIn its 35 years of independence, Uganda has weathered some of the worst tragedies and strife that can befall a country. Tribal and territorial conflicts have been a constant factor as factions struggle for control over Uganda and its productive resources. The country suffered severely during Idi Amin’s military regime between 1971 and 1980, and then experienced repeated coup attempts over the next five years which culminated in civil war in 1986. An estimated 500 000 Ugandans died during the course of the terrorism and civil war, and up to another one million people were forced to flee their homes. From 1971 to 1980, a number of economic policy decisions were taken with the aim of enriching ķlite supporters of the regime. This was done at great economic cost, as most of the policies introduced were protectionist and expropriative, very few economic activities were left untouched by the intrusion of the public sector and virtually no industry was able to operate efficiently or competitively. By the end of the civil war in 1986, Uganda faced border struggles with Kenya, a collapsed economy, a history of rampant corruption and more than 100 000 refugees within its borders. The decade since then has seen steady progress in social and economic spheres.
Uganda’s macroeconomic and industrial indicators are just now approaching the levels recorded in 1970 when savings rates and private investments were 15 percent of GDP; per caput GDP had peaked at $331; exports of coffee, tobacco, tea and cotton were sufficient to produce a consistent current account surplus; and the multifaceted transport system, a legacy of British colonial times, allowed the smooth functioning of trade and market operations. Social conditions were relatively good, with a 70 percent child immunization rate, good-quality education services and a broad-based health care network, even in rural areas. FIGURE 21CHANGE IN REAL GDP GROWTH IN UGANDA 1965-70
TO 1997-98 In the 30 years from 1965 to 1995, Uganda’s average annual growth in real GDP was a moderate 2.8 percent, but this average hides a decade-long decline from the beginning of the Idi Amin regime to its eventual overthrow in the early 1980s. The country’s economy had been growing at almost 5 percent per year in the first years of national independence (see Figure 21). Between 1971 and 1981, however, real GDP dropped by 20 percent and real per caput GDP by 60 percent, to less than Ush 100 000 per year ($100). Exports also plummeted by 60 percent. By 1981, government spending on education and health in real terms was 27 and 9 percent of 1970 levels, respectively. The economy showed some improvement in the early to mid-1980s with positive real growth returning, but many of the more modern sectors had been damaged, manufacturing was operating at 5 percent of capacity and the composition of output was heavily agricultural and domestically oriented. In general, poor performance was due to inappropriate price and trade incentives, poor government decisions, badly functioning credit markets and high levels of economic risk.
The slow economic recovery that had begun in 1981 gained momentum subsequently. Average economic growth accelerated from 3 percent in 1981-86, to 6.5 percent in 1987-97. Annual per caput income has risen to slightly above 1965 levels ($301 in 1997) and structural reform has occurred throughout the economy. Greater confidence in the economy and improved political conditions have encouraged savings and investment as well as increased use of the monetary system. In 1986, more than one-third of the entire economy and one-half of the agricultural economy involved barter and other non-monetary transactions, but those figures have lessened with the better functioning of the financial system. Currently, about 24 percent of the economy operates outside monetary channels.
Substantial amounts of international loans and assistance have been channelled to support Uganda’s economy. In the ten years of economic recovery since 1988, the country has received concessionary loans from IMF and the World Bank totalling more than $4 billion. These credits have been made through extended credit and structural adjustment facilities in IMF and the World Bank, and have been used to support the rebuilding and reorientation of the macroeconomy. In some years, external assistance has represented as much as one-fifth of GDP. In November 1997, an IMF loan of $140 million was approved for the 1997-2000 period. In addition to multilateral donors, Uganda has received substantial support from individual members of the European Union as well as Japan. As a result, Uganda today is in a fragile recovery from a long period of self-destruction. The investment rate is up, inflation has been kept relatively low for four years, the government has reduced its expenditures and created improved conditions for private investment, and the current account deficit has been cut. The country’s progress in structural and sectoral policy reform earned forgiveness of 20 percent of its foreign debt in early 1998. Under the heavily indebted poor countries (HIPCs) initiative, the World Bank and IMF have forgiven $650 million of Uganda’s $3.25 billion total external debt. This move will reduce even further Uganda’s debt-to-GDP ratio, which was 80 percent as recently as 1993/94 and is expected to decline to 50 percent in 1998. FIGURE 22SECTORAL DISTRIBUTION OF GDP IN UGANDA
Macroeconomic conditionsUganda could be considered a success story for structural adjustment programmes. In ten years Uganda’s economic reforms have reduced the current account deficit from 50 to about 10 percent of GDP, reduced its debt service from over 125 to 21 percent of GDP and lowered inflation from 237 to 11 percent. Achieving these levels has not been easy, but Uganda has moved relatively rapidly towards the ambitious goals it set in its Economic Recovery Programme in 1987. In 1997, GDP was $6.3 billion, of which 88 percent was accounted for by private consumption, 9 percent by government expenditures and 20 percent by investment spending (both private and public). The real growth rate in 1996/97 (the fiscal year runs from July to June) was 5 percent, with 5.5 percent forecast for 1997/98 and 7 percent for 1998/99. With the population increasing at about 3 percent per year, those growth rates imply significant gains in per caput income. The economy is largely agricultural, although this sector is gradually declining in importance as manufacturing and the wholesale and retail trade recover some of their former capacity (see Figure 22). Uganda’s economic programme of reform consisted of an ambitious and wide-ranging agenda, encompassing physical and economic rebuilding, as well as a shift from a war-oriented to a production-oriented society. On the list of critical changes were: the liberalization of producer and consumer prices; the stabilization of inflation; decontrol of the overvalued exchange rate; a 60 percent reduction of the military forces; a decrease in government ownership of industry; the rebuilding of infrastructure; and restoration of the financial system and credit relationships. The immediate steps taken in 1987/88 set the tone for a determined move towards a restructured economy. In the first in a series of devaluations, the shilling was replaced by the new Ugandan shilling in 1987 and devalued by 60 percent, increasing exports and lowering imports. Producer prices for agricultural exports were allowed to rise in response to the devaluation and production followed suit. Within the next few years, government expenditures declined substantially, although priority sectors of primary health care, road maintenance and education were protected from cuts. While not meeting the original targets for reductions, 20 000 soldiers were discharged from military service and civil service employment was reduced. In order to improve the savings rate and develop a functioning credit system, the government liberalized interest rates and initiated a market in treasury bills to finance its operations. All of these moves contributed to a more stable macroeconomic environment.
Markets of all types began to function more smoothly, consumers and producers became
willing to operate within the monetary system and importers and exporters faced world
prices. Payment for critical imports was guaranteed by donor agencies, thus heading off
bottlenecks and credit problems that would keep out needed capital products. Current conditions
The government is projecting GDP growth for 1997/98 at a rate of 7.5 percent but, owing to excess seasonal rainfall, outside observers are anticipating only about 5.5 percent. The weather problems of 1996 and 1997 slowed growth in agricultural production particularly, the economic mainstay, to only 1.1 percent in 1996/97, which resulted in some shrinkage of the non-monetary sector of the economy. Expectations are that the economy will recover relatively quickly if government spending is kept in check, preventing inflation from rising again and restoring GDP growth to near the levels of 7 to 8 percent. The current account deficit for 1996/97 was 6.5 percent of GDP, while it is projected to be slightly lower in 1997/98 at 5.8 percent. Excluding official grants, the current account deficit would have been 6.1 percent of GDP in the past year. Foreign exchange reserves have gradually risen to 4.6 months’ worth of imports in 1996/97. Public revenue shortfalls continue to be a problem. The government has been under strong pressure from international lenders to improve revenue flows and create systems that will eliminate smuggling and corruption. Some improvement was seen between 1991 and 1995/96 with government revenues doubling to 11 percent of GDP and the introduction of a value-added tax. A change in the governance of the revenue service was carried out in late 1997 to stem apparent corruption. This was one of the conditions of the $140 million IMF loan approved in November 1997. Nonetheless, tax revenues continue to fall short of government goals and the high level of non-monetized activity is part of the problem. Another problem is in implementing completely the new value-added tax. The government’s recent policy orientation and priorities continue to emphasize broad growth and diversification, monetary and fiscal stringency and protection of the poor during continued economic adjustment. These policies are described in the Policy Framework Paper developed in cooperation with the major multilateral creditors and disseminated in October 1997. Financial sector reforms and privatization of some further manufacturing facilities and government-owned utilities are going ahead. These changes are expected to increase government revenues, reduce the civil service and spawn substantial private investment in Uganda. The government’s goal is to see an increase in investment from 20 to 23 percent of GDP during the three-year planning period.
FDI has picked up in recent years since the liberalization of foreign ownership in 1991. FDI was only $3 million in 1993 but had grown to $160 million in 1996/97. Combined with large inflows of capital in the form of concessionary loans and aid, Uganda has incurred a balance-of-payments surplus in the past few years. This has put some upward pressure on the Ugandan shilling at times, and the government has had to work hard to avoid exchange rate fluctuations. Some exchange rate intervention was performed in 1996/97 and again in 1997/98 to maintain a stable currency. This has been made difficult by the increasing use of the Ugandan shilling for business transactions in the eastern part of the Democratic Republic of the Congo. Remittances from that region have jumped by 70 percent from normal flows, and some observers estimate that up to one-third of Ugandan currency is in use in the Democratic Republic of the Congo. Liquidity problems may ensue. Privatization has been carried out rather slowly. The IMF credit granted in
November 1997 is designed in part to hasten the process. There have been
efficiency-enhancing investments and privatizations in many sectors, but
telecommunications, banking and electricity are all still in need of rehabilitation. The
current schedule agreed on with external donor support is to complete the privatization
process by 1999 through the sale of more than 70 public mining and manufacturing
enterprises. However, in early 1998, a controversy erupted in the parliament over the
privatization programme amid concerns that companies were being sold too cheaply to
foreign investors, and that credit would be unavailable to the rural population after the
sale of the Uganda Commercial Bank. Similar issues have held up the sale of the Uganda
Post and Telecommunications enterprise. Trade
Trade is important to Uganda, but is not highly diversified. As a share of GDP,
trade in goods and services comprises 25 percent, with imports accounting for the bulk of
that total – nearly 20 percent of GDP. Uganda is a member of the Common Market for
Eastern and Southern Africa (COMESA) and as such has low and preferential tariff treatment
with the other 12 member states. Uganda also participates as a member of the International
Coffee Organization, the International Sugar Agreement and the International Cotton
Council. FIGURE 23AFIGURE 23BFIGURE 24AUGANDA: PRODUCTION OF MAJOR EXPORT CROPS,
1987-1997 FIGURE 24BUGANDA: PRODUCTION OF PRIMARY FOOD CROPS,
1987-1997 Despite COMESA, Uganda’s major trading partners for imports are in Europe and Asia, and import duties have contributed the largest share of government revenues until very recently (40 percent in 1994/95). An export tax on coffee alone contributed 50 percent of the government’s revenue in 1992/93 when it was eliminated. The average tariff rate was 17 percent in 1994/95, but some reduction has occurred since then, including the replacement of the 145 percent tariff on petroleum imports with a 215 percent excise tax. Similar switching of an excise tax for import duties was applied to luxury goods in 1993/94, although they still face relatively high tariffs. Agricultural inputs enter duty-free. Uganda runs a substantial deficit on its current account, owing to its imports of vehicles, machinery and equipment and petroleum which together currently account for about one-half of total imports. These are largely funded by foreign assistance credits. Imports have increased faster than exports, especially industrial products to support economic restructuring (see Figure 23). While the country produces some of its energy needs through hydropower, it lacks petroleum resources and must import petroleum for a major part of its manufacturing and transportation operations.
Further trade liberalization has been promised by the government and encouraged
by international creditors. Among the policy changes proposed in the current budget are
the reduction of import duties on goods from non-COMESA countries from 30 to 20 percent
and the elimination of import bans on all products. Agricultural conditions
The Ugandan economy is heavily oriented towards agriculture. Accounting for 44
percent of total output and 80 percent of employment, the agricultural sector is
concentrated in the southern part of the country where weather patterns provide for two
growing seasons. Table 4 shows the output of various agricultural products in Uganda. The
most important export crops are coffee, cotton, tea and maize. The main food crops are
tubers and roots, maize, beans, sesame and sorghum. Almost half of agricultural production
(19 percent of GDP) is traded or bartered for subsistence consumption outside the market
system. Most agriculture is performed on farms of less than 2 ha, using family labour and
non-mechanized methods. Subsistence production of agriculture still accounts for about
two-fifths of agricultural output, and one-fifth of total economic output. TABLE 4Agricultural production in Uganda, 1996/97
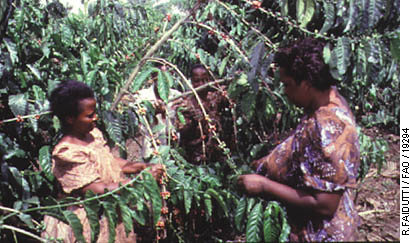
PICTURE 8Family members gathering coffee berries
Prior to the economic collapse, Uganda had been self-sufficient in food, thanks to its good soil fertility and favourable climate. Currently, 6 percent of Uganda’s total imports are food products (sugar, vegetable oil and cereals). Agriculture had also been a large earner of foreign exchange and was the main reason for successive current account surpluses. There is a strong possibility that this position can be regained, according to the positive trends of the economic reforms under way. Only about one-third of the land available for cultivation is currently in use, and almost none is irrigated. The largest area of cultivated land is planted with bananas (30 percent of cultivated area, concentrated in the mountain systems in the west and east); cereal planting takes up 23 percent of cultivated land, largely in the north and northwest of the country, followed by, in declining order of land utilization, roots, pulses, oilseeds, coffee and cotton. Despite the dominance of Uganda’s agricultural sector in GDP and employment
and its growth in absolute terms, it has actually receded substantially over the past
decade in relative terms. Following the breakdown in the economy in the 1970s and early
1980s, agriculture was practically the sole productive activity for Ugandans, and was
critically important to the country’s survival. However, both export agriculture and
agricultural processing were greatly damaged, leaving subsistence agriculture as the
primary economic activity. FIGURE 25COMPOSITION OF UGANDAN EXPORTS, 1990-1996
As recently as 1990, agriculture accounted for 57 percent of GDP in Uganda, and coffee accounted for 80 percent of exports. The Economic Recovery Plan successfully diversified the economy so that manufacturing now accounts for 12 percent of output, up from only 5 percent in 1987. The agricultural sector has also become more diversified. Coffee has dropped to about 60 percent of all exports, but export revenues from coffee have fluctuated very widely since the 1989 breakup of the quotas established by the International Coffee Organization (see Figure 25). Food crops account for 71 percent of agricultural output, and take up 92 percent of planted land. This subsector was seriously damaged in late 1996 and early 1997 by drought conditions, and again in late 1997 and early 1998 by extremely heavy rainfall and then flooding. Because of the drought, total agricultural production grew by only 3.9 percent from 1996 to 1997, compared with 8.6 percent the previous year. The combined effect was a drop of 25 percent in crop production between early 1997 and early 1998, which caused IMF to adjust its forecast for GDP growth from 8 to 5.5 percent for 1997/98. Food-crop production fell substantially short of the population’s needs in 1997. Severe food shortages declared in 21 out of 39 government districts, especially in some of the most vulnerable areas of the north, northwest and southwest which have large refugee settlements.
Uganda is Africa’s leading coffee producer. Coffee revenues have been a mainstay of the government’s efforts to reduce the current account deficit and restore the foreign reserve position. The early 1990s saw substantial increases in international coffee prices, and Uganda was in a good position to export. However, high prices brought new producers into the market and production volumes have already increased, bringing prices back down (see Figure 26). The coffee sector has been more affected by the 1997/98 rains than by the earlier drought because of harvest timing. Delays and stoppages in picking and drying occurred at the beginning of the harvest season in late 1997 and processing plants were underutilized because of a lack of coffee crop. Export volumes were cut by almost two-thirds from the previous year in the initial stages of the harvest, but recovered substantially by the end of the export season in April 1998. Nonetheless, price weaknesses continue to reduce export earnings from coffee. Average prices for Uganda’s main variety of coffee, robusta, are forecast to fall by 9 percent between 1997 and 1998. Furthermore, the new suppliers and a new quality control system implemented by a major international coffee trading company based in London may permanently harm the market for Ugandan coffee beans. There have been reports recently of excessive moisture in Uganda’s coffee shipments, and there is serious concern that negative publicity may cause buyers to try other coffee producers now that new production is available. Tea and cotton are also important traditional export crops for Uganda. Tea
production rose again in 1997/98, compared with 1996, and export earnings should rise as
well. Cotton production was damaged by the drought in the early part of 1997, which
curtailed planting, and then the late-season rains interfered with the transport of cotton
to the ginning plants late in the year. Thus, at 110 000 bales in 1996/97, cotton
production is little more than half the volume of the previous year; however, cotton
output is still greatly increased since the early 1990s. A substantial amount of
multilateral assistance has been directed at modernizing the cotton processing facilities
in order to return cotton to being a major foreign exchange earner for Uganda. FIGURE 26
Among other important crops grown in Uganda are sugar, grazing livestock and forestry. Each of these sectors has shown substantial recovery since the collapse of the 1970s and 1980s, but has yet to become an important economic contributor. Fishing, which is concentrated in the major lakes that dot Uganda’s borders and interior, is an important source of protein for Uganda’s population as well as producing significant exports.
The past two years of weather-related problems illustrate the fragility of
Uganda’s economic dependence on agriculture. Flooding and landslides caused by the
torrential rains wiped out bridges and roads, swept away fields of planted crops and
disrupted harvesting, delivery and marketing of food crops. Food prices jumped quite
precipitously in some regions, especially where roads became totally impassable and crops
could not be delivered to processing plants. The decline in food production and lower
growth in agricultural production overall in 1997/98 both contributed to slower overall
growth. Agricultural issues and policiesLack of modern farming methods. The rural areas of Uganda, including farming practices, have changed relatively little over the last three decades. Ninety percent of the rural population are subsistence farmers or fishers. Their productivity has been hampered by lack of machines or even animal traction; pre- and post-harvest pest infestations; the vicissitudes of drought and flood; inadequate storage facilities; and the destruction of much of the excellent transportation infrastructure that existed 30 years ago. Electricity is available to about 5 percent of the population, half of whom are in Kampala and the rest in major towns.
With its recently released agricultural modernization plan to the year 2002, Uganda is exiting the rehabilitation phase and entering the development phase of economic growth. Uganda will put more emphasis on regional trade in local foodstuffs and on newer, high-value agricultural products destined for international markets. The government wants to improve the productivity of subsistence farmers who are the backbone of the economy, and expand by 6 percent annually the area under crops, particularly for large-scale commercial farmers. The underutilization of cultivable land has been a key weakness in Uganda’s efforts to reduce poverty in rural areas. It stems from the historical neglect of the smallholder farmers and inability to extend mechanization to large numbers of farmers beyond the northeastern area where it was adopted early on. Among the agricultural policy changes encouraged since 1990 has been acceptance of the reliance on small farmers for food production, reduction of transaction costs and market failures in land and credit markets and the expansion of agricultural services. It is estimated that the cost of implementing the modernization plan, published in January 1998, will be U sh 367 billion (roughly $305.8 million). The four key areas for intervention are: improving research, extension and farmer linkages; targeting production in certain agricultural zones; improving credit access in rural areas; and promoting the development of agro-based rural industries. Success is dependent on continued investment in the country’s transport network, particularly rural feeder roads.
The modernization plan tackles head-on the fact that Uganda, a country with the potential to feed much of East Africa, has extremely low crop yields owing to subsistence farming practices. Fertilizer use is very low as there is no systematic market and prices vary widely throughout the country. The plan calls for the expenditure of $120 million on improved and decentralized research and extension services. However, even though most farmers are women, the extension programme gives little emphasis to gender issues and the number of extensionists remains minimal. Given the volatility of international markets for coffee and for the country’s other traditional exports – cotton, tea, sugar and tobacco – the government is eager to diversify its economic base. One way in which it intends to do so is by increasing the sales of non-traditional agricultural exports. In 1996, non-traditional agricultural exports accounted for 34.5 percent of export earnings, compared with 14 percent in 1990. The two types of non-traditional exports are: • Low-value traditional foods that are not traditionally exported, particularly maize, rice, beans, oilseeds and dairy products. These are sold to Uganda’s neighbouring countries. • New, high-value agricultural products destined for wealthy markets: spices, fancy vegetables, fruits, nuts, livestock products including hides and live goats for the Near East, fish, silk, pyrethrum and citronella oil. Uganda’s storage and transportation infrastructure is weak so producers have difficulty meeting the developed world’s complex requirements for highly perishable produce, be it for crisp dwarf vegetables or just-budding hothouse flowers. “The export markets are limited, competitive and volatile,” the modernization plan states. “Requirements are also demanding in terms of produce type, size, quality, packaging, delivery schedule and frequency.” As a landlocked country, Uganda is at a disadvantage in competing with coastal neighbours such as Kenya for sales of these high-value crops. Regional markets for lower-value produce are more accessible to Uganda. The modernization plan identifies two types of regional client: other East African countries such as Kenya, the United Republic of Tanzania and Ethiopia which suffer regularly from food shortages owing to drought and flooding; and international agencies serving refugees and displaced persons in the region. The modernization plan calls for a 20 percent expansion in the production of maize, rice, beans, oilseeds and dairy products for sale regionally. The Achilles’ heel of this regional approach is the persistence of trade barriers between countries of the region. COMESA has achieved some success in breaking down regional trade barriers with a mandate to promote trade, investment and payments among the signatories. Another issue is whether neighbouring governments and relief agencies will be in a position to buy Uganda’s foodstuffs. Money is not the only problem. The World Food Programme (WFP) has been discouraged from buying foodstuffs in Uganda because local trading houses have not always adhered to their contractual obligations with WFP, and the food quality does not always meet WFP’s standards.
One of the greatest hindrances to growth in Uganda is the poor transport infrastructure. A lack of institutional capacity combined with natural disasters has held back the roads rehabilitation programme. While principal and trunk highways have been restored, it is estimated that one-quarter of feeder roads are impassable during the rainy season. In 1996, the World Bank and Uganda signed a ten-year programme of $1.5 billion for roads. In 1997, the World Bank invested $30 million to build institutional capacity for road construction and maintenance, and another $30 million for emergency road repairs necessitated by damage inflicted by the torrential rains and flooding. Unavailability of farm credit. If agriculture is to be Uganda’s economic engine of growth, as it must be, investment must focus on the sector. But peasant farmers have almost no access to credit to improve their productivity or to begin micro-enterprises. Formal banks do not have adequate branch networks in rural areas and tend to view rural lending as too risky and expensive. Efforts have been made to increase access to credit for small farmers. These include the Rural Farmers’ Credit Scheme which was funded by external aid donors and aimed specifically at small food growers. Farmer cooperative organizations exist in many villages and have been an important source of interim financing and other support for individual farmers. The modernization plan seeks $37.27 million to improve access and availability of credit in rural areas. The three-stage plan would begin with small-scale microcredit groups encouraging peasants to save as well as offering them access to small sums of credit from external sources. Those would develop into fully fledged village banks linked to the formal banking system. Later, the village banks would coalesce to form district or regional banks, competing with the established banks. Village-level producer cooperatives and non-governmental organizations (NGOs) are expected to be key players in development of this model. Uganda faces economic instability but has resources for development. In general, the Ugandan economy is still vulnerable to several sources of instability. The main one is weather, which can create boom times such as the 1992/93 period of 8.4 percent GDP growth, but can also create a severe production crisis in agriculture, such as in 1996 and 1997, thus slowing overall growth. There is little resilience in the agricultural sector to these supply shocks because of the lack of irrigation, the relatively underdeveloped mechanization, and poor storage, transportation and distribution mechanisms. Border military activities and refugee populations are another source of instability. The country currently shelters an estimated 265 000 refugees from the Sudan, the Democratic Republic of the Congo and Rwanda who live in rural settlement camps and temporary transit points. These people are generally subsistence farmers who have faced displacement and insecurity in northern Uganda from insurgencies and attacks on their camps. In 1997, a large number of Sudanese refugees returned to areas in southern Sudan, while others voluntarily left the refugee camps and are living along the northern border of Uganda. The other source of instability for the Ugandan economy is also a source of
stability: foreign assistance. Uganda has performed well in its macroeconomic
restructuring, so is favoured in the lending programmes of multilateral and bilateral
donors. However, many of the government’s continued reforms are almost entirely
dependent on support from outside sources. Imports of equipment and machinery, which are
urgently needed to continue strengthening the manufacturing sector, are generally financed
by foreign funds, so there is no threat of those imports not being paid for. This process
of financing physical capital imports also maintains the current account deficit that
could not be maintained without aid. Nonetheless, the long-term benefits of increasing
manufacturing capacity justify the trade imbalance.
|