| |
|
The political economy of development |
|
| Home- Themes- Reports- Statistics/Search- Lecture notes/News- People's Century- Puro Chile- Mapuche |
| Make your work easier and more efficient installing the rrojasdatabank toolbar ( you can customize it ) in your browser. |
|
| Reproduced from the United Nations Food and Agriculture Organization website
The State of Food and Agriculture 1998 Asia and the PacificREGIONAL OVERVIEW
Economic developments
Despite the financial crisis in East and Southeast Asia and the effects of the El Ni±o phenomenon, economic growth in developing Asia and the Pacific in 1997 again exceeded that of any other region and contributed to a rising per caput income in most countries. However, the regional growth rate of 6.1 percent was lower than the 7.5 percent recorded in 1996 (in turn lower than the 8.2 percent of 1995), and all subregions of Asia (except for the central Asian republics) shared in the slowdown. There was a substantial variation across countries, with Southeast Asia and the Republic of Korea being particularly affected by currency and financial turmoil in the second half of the year. In Southeast Asia as a whole, economic growth declined by almost half. Economic growth in Thailand and a number of Pacific Island countries was actually negative. Average growth across the newly industrialized economies of Hong Kong, the Republic of Korea, Singapore and Taiwan Province of China slowed but remained substantial at 6 percent. Economic activity in China continued to cool down but still expanded at an impressive 8.8 percent. In India, GDP growth slowed from 7.5 to 5 percent. As the full impacts of the currency and financial crisis take hold, real economic growth in developing Asia is expected to decline to about 4 percent in 1998 before making a slight recovery to a little more than 5 percent in 1999.9 The most striking aspect of Asian economic performance in 1997 was the combined
effect of two negative events in Southeast Asia: the countries in this subregion suffered
from El Ni±o-related climatic disturbances, with implications for agricultural
performance, food security and public health, at the same time as suffering from severe
financial disturbances created by currency depreciations, reversals of net capital flows
and strains on banking systems and capital markets as well as on corporate liquidity and
credit availability. By the end of the year, these financial disturbances had spread to
the Republic of Korea and precipitated IMF-led rescue packages for Indonesia, the Republic
of Korea and Thailand, totalling more than $100 billion. FIGURE 27A stylized account of the regional currency and financial crisis can be explained as follows. While rapid globalization had brought substantial benefits to developing Asia, it also heightened risks associated with the failure to address policy mistakes, weaknesses in financial sector institutions and problems in corporate and public governance. As trade grew rapidly and nominal exchange rates remained effectively pegged to a rising US dollar, substantial current account deficits arose. These were partly in response to structural changes in the “real” side of the affected economies and partly due to an appreciation of their real exchange rates. The combination of increased current account deficits and rising real exchange rates was sustained by private capital flows from abroad. Only a small fraction of this flow came in the form of FDI; the remainder came either through portfolio investment or through the banking sector, especially as short-term loans. Once the surge of private capital inflows started, a rampant increase in domestic asset prices ensued, in turn inducing further capital inflows. The surge of private foreign capital brought about imbalances in the banking sector of the countries most affected, as foreign liabilities of commercial banks increased more rapidly than foreign assets and much of the collateral for loans consisted of real estate and equities, the prices of which contained a large speculative component. There was also an imbalance in the maturity structure of banks’ assets and liabilities. Financial institutions were often subject to non-transparent and lax regulatory enforcement. In addition, the behaviour of some financial institutions reflected an implicit belief that their financial liabilities were guaranteed by their respective governments. In a context of surging capital inflows, implicit government guarantees to creditors encouraged excessive risks to be taken and allowed loan portfolio quality to deteriorate. An implicit belief that effectively fixed exchange rates would be maintained indefinitely also discouraged the prudent hedging of foreign liabilities.
While saving was generally high, it was often not invested most productively. As falling returns began to disappoint investors, particularly following the 1996 export slowdown, their exuberance faded rapidly. The five economies most adversely affected by the crisis (Indonesia, Malaysia, the Philippines, the Republic of Korea and Thailand) recorded an aggregate net foreign capital outflow of $12 billion in 1997, compared with an inflow of $93 billion in 1996. The values of currencies began to fall and interest rates to climb in these countries. High, unhedged debt-to-equity ratios, which had offered easy financial assistance for growth in better times, began to imperil company finances as well as those of the financial institutions that lent to them. The social consequences of the economic crisis are likely to be serious, although they are becoming apparent more gradually. Unemployment and inflation are rising, while company closures and the resultant redundancies are leading to massive migration flows out of the countries affected. Social safety nets, which were already weak or poorly developed in many places, are coming under increasing pressure. These problems vary in gravity, in some cases giving cause for concern. For instance, in the Republic of Korea, the wholesale and retail trade index fell in the second half of 1997 for the first time in 18 years, and it is expected to fall again by record amounts during the first half of 1998. Such a slowdown in consumption is indicative of both low income growth and loss of consumer confidence. Indonesia was particularly hard-hit by the financial crisis, the impact of which was compounded by internal political problems and extensive forest fires in areas affected by El Ni±o-induced drought. The population has suffered from food shortages and price increases; despite very weak private consumption, the inflation rate is expected to rise from the 11 percent recorded in 1996 to 16 percent in 1998; and the country’s already high unemployment numbers are expected to increase significantly (reaching 8 or 9 million in 1998). The Philippines weathered the financial crisis with a satisfactory economic performance featuring a 5.8 percent growth in GNP, a level supported by substantial remittances of hard currency from overseas contract workers. Thus, the Philippines is expected to emerge from the crisis ahead of most other countries in the region, although it will still face lower growth and higher unemployment rates, the latter being expected to increase from 8.7 percent in 1997 to more than 9 percent in 1998.
For the countries of the region, and indeed for the rest of the world, economic prospects greatly depend on the pace and extent of the recovery in Japan. Domestic economic problems in Japan, including those in the financial sector, are very serious and likely to remain so for some time. Consequently, at least in the short term, Asian economies can expect little in the way of stimulation from Japan’s import demand. Furthermore, Japanese investments in the region are also depressed. If Japan enters into a protracted recession, this can only mean gloomier economic prospects for the region as a whole, and especially for closer trading partners.
In any case, it will take some time before countries in the region resume rates of growth comparable to those of the recent past. For some economies the road back may be longer than for others but, provided policy corrections are made and institutional reforms carried through, the foundations that propelled rapid growth in the past should do so once again. Economic growth in China has been steadily decelerating since 1992, as efforts to avoid economic overheating through fiscal, monetary, price and credit policies have taken effect. For 1997, economic growth was 8.8 percent. While the 1997 financial crisis in Asia did not have an immediate impact on China, it may have medium-term effects by weakening demand for the country’s exports, increasing competition for their markets from countries with sharply depreciated currencies and, possibly, reducing foreign investment. Meanwhile, redoubled efforts to address weaknesses in the banking and state-owned enterprise sectors may help to reduce China’s vulnerability to similar crises in the future. Weather effects, more moderate demand for manufacturing output and infrastructure bottlenecks contributed to a reduction in economic growth in India in 1997, as real GDP growth slowed from 7.5 to 5 percent. The country’s current account deficit rose by more than $2 billion as imports, facilitated by trade liberalization, increased to meet a shortfall in domestic production of basic necessities, including food. The Indian economy is expected to expand by between 6.5 and 7 percent in both 1998 and 1999, with stronger growth limited by infrastructure constraints. A depreciation of the rupee may be required to maintain external competitiveness in the face of the massive depreciations in Southeast Asian currencies.
Growth in real GDP of the newly industrialized economies (Hong Kong, the Republic of Korea, Singapore and Taiwan Province of China) slipped to 6 percent in 1997, largely because of weaker export performances as world demand for electronics, semiconductors, steel and petrochemicals moderated. Inflation remained subdued at 3.5 percent. The transfer of Hong Kong’s sovereignty to China occurred smoothly in mid-1997. The new Hong Kong Special Administrative Region continues to develop as a financial and business services centre, although the region’s economic crisis and higher interest rates have reduced the pace of economic activity. In late 1997, the currency and financial turmoil in Southeast Asia spread to the Republic of Korea, which eventually resorted to an IMF-led rescue package of more than $50 billion, conditional on substantial policy reforms. The restrictive policy measures required imply that the economy will contract, and expectations are that full recovery to the country’s potential growth path will take at least two years. Singapore emerged from the region’s financial crisis in a better economic condition than its immediate neighbours, although it suffered some currency depreciation and a substantial fall in its stock market index. Spillover effects, especially from Indonesia, are likely to keep Singapore’s economic growth subdued in the near future, however. The financial crisis left Taiwan Province of China relatively unscathed, but reforms in the banking and financial sectors and the policy of encouraging high-technology activities in the country are continuing. Southeast Asia suffered both from the physical effects of El Ni±o and the economic consequences of the financial crisis in 1997 and early 1998. Economic growth declined from more than 7 to less than 4 percent. Cambodia’s economic performance was lacklustre, with a real GDP growth rate of just 2 percent, an inflation rate of more than 9 percent and budget revenues of less than 10 percent of GDP. However, agriculture is the largest sector in Cambodia’s economy and its growth rate in 1997 picked up to 4.9 percent, compared with just 1.8 percent in 1996. Despite favourable macroeconomic fundamentals, Indonesia was hit particularly hard by the regional crisis in late 1997, as mentioned above. The country is now undergoing comprehensive economic reforms in the context of an international rescue package of roughly $40 billion. In 1997, the Lao People’s Democratic Republic continued its steady growth, but its trade and currency suffered from the crisis in neighbouring Thailand, its largest trading partner. In Malaysia, economic growth slowed to 7.5 percent in 1997 as the financial crisis took its toll through a massive depreciation of the ringgit and a steep decline in stock market values. Fiscal and monetary measures introduced in response to the crisis in the later part of the year also restrained growth. Myanmar continued the slow process of implementing a market economy, and its entry into the Association of Southeast Asian Nations (ASEAN) should improve its integration into the regional and global economies. Thailand’s extended period of high growth ended sharply and growth turned slightly negative in 1997 as the collapse of the baht precipitated the regional currency and financial crisis. Reforms under an international assistance package have proceeded well and, after further negative growth in 1998, the economy is expected to return to positive, if slight, growth in 1999. Viet Nam registered strong economic growth of 9.2 percent in 1997, supported by vigorous growth in both agriculture and industry. Growth is likely to be more moderate in 1998, as Viet Nam is affected by the events elsewhere in the region. In South Asia, economic growth slipped below 5 percent in 1997, after averaging
6.8 percent from 1994 to 1996. Differences in investment and growth rates in agriculture
and manufacturing accounted for wide disparities in growth among the subregion’s
economies. Bangladesh’s economy grew rapidly in agriculture but lagged in
manufacturing, posting a 5.7 percent overall growth rate. Low increases in food prices
helped the country maintain its inflation rate at about 4 percent. GDP growth in Nepal
declined to 4.3 percent in 1997, primarily owing to a slowdown in the non-agricultural
sectors that was brought about by infrastructure and human-capacity constraints.
Pakistan’s growth rate dipped to 3.1 percent in 1997 and the country experienced
increasing macroeconomic imbalances as its fiscal and current account deficits increased
to about 6 percent of GDP. Sri Lanka experienced rapid growth in both agriculture and
manufacturing, which helped increase its overall growth rate to a substantial 6.3 percent
while bringing inflation down into single digits. Agricultural performance and issues
Overall, 1997 was an unfavourable agricultural year for the region. Indeed, the rate of expansion of agricultural production fell to only 2.6 percent,10 the lowest rate recorded in the 1990s and only the second time in the same period that agricultural production expanded by less than 4 percent. This reflects declines in the rate of agricultural production growth in most of the major countries of the region, including Bangladesh, Cambodia, China, India, Malaysia, Myanmar, the Philippines and Viet Nam. Agricultural production actually declined, by an estimated 2 to 3 percent, in Indonesia. The rate of expansion of agricultural production rose in Nepal, Pakistan, the Republic of Korea and Sri Lanka, although for this last country most of the increase represented a recovery from the sharp decline experienced in 1996. In China, a third consecutive year of bumper grain harvests contributed to strong, if more moderate, economic growth and reduced inflation in 1997. Measures introduced since 1995 under the Grain Bag Policy, such as greater public investment in agriculture and higher procurement prices, have kept agriculture growing at 4 percent, following two years at about 7 percent. At 441 million tonnes, total cereal production was lower than in 1996, but still the second highest ever. Grain-sown area has expanded by several million hectares since 1994, most notably in the coastal provinces. Agriculture accounts for slightly more than one-quarter of India’s GDP, but production grew by little more than 1 percent in 1997, as monsoons arrived late in some areas and unseasonable and heavy rainfall occurred in others. In the first major trade liberalization of agricultural products since the current reforms began, the Government of India partially or completely liberalized imports of 150 food items and reduced maximum tariff rates from 50 to 40 percent. Meanwhile, India remains a substantial net exporter of agricultural products and is usually self-sufficient in foodgrains. The government has also begun to consider the rising cost of subsidies, including agricultural subsidies such as those on foodgrains, fertilizers and water and power – these last two being substantial. A reduction of these subsidies would promote more efficient input use and grain distribution, but could have significant equity impacts and be politically difficult to implement. In Bangladesh, the agricultural sector registered a 1 percent expansion in production following two years of a strong, 4.5 percent growth, helped by greater input availability and expanded rural credit. Agriculture still accounts for about one-third of GDP and more than two-thirds of employment. However, food and agricultural production has barely kept up with population growth in the course of the 1990s, more than half of the population is below the food-based poverty line and child and maternal malnutrition are widespread. There is a further risk that the country may experience reduced competitiveness in labour-intensive exports such as garments and frozen foods because of the large depreciations of Southeast Asian currencies. In Indonesia, agricultural production was reduced by drought brought about by the El Ni±o phenomenon, compounded by forest fires and the resulting haze. This, together with the sharp depreciation of the rupiah, caused food prices to rise. The Government of Indonesia responded to the drought with cloud-seeding activities, the provision of free seeds to farmers whose food crop (especially rice) production failed and the distribution of hand tractors to accelerate planting in the main rice-producing areas. Nevertheless, this year’s paddy production is forecast to be significantly smaller than the already reduced one of 1997. Large-scale international assistance is required to meet the shortage of rice. The government plans to import approximately 1.5 million tonnes, leaving an uncovered deficit estimated to be 2 million tonnes.
In the Democratic People’s Republic of Korea, a severe drought in the summer of 1997 as well as a destructive typhoon, both occurring after two consecutive years of floods, resulted in a desperate food situation that was characterized by severe hardship for the population and rapidly declining nutritional standards. Total cereal production in the country in 1997 was down to an estimated 3.7 million tonnes from the 4.5 million tonnes of 1996 and the 5 million tonnes recorded as late as 1994. The effects of the three consecutive years of natural disasters have, however, only aggravated the severe structural problems in the economy, including the agricultural sector. Cereal production has indeed followed a consistently downward trend since peaking at 7.1 million tonnes in 1986. In the Lao People’s Democratic Republic, in 1997, despite floods affecting some areas, improved climatic conditions overall and increased incentives for agricultural production led to higher growth levels in the agricultural sector, which continues to account for more than one-half of the country’s GDP. The important sector of subsistence agriculture helped to buffer the real economy from the regional crisis to some extent, but the events in Thailand combined with the effects of flooding to push up agricultural prices. In mid-1997, serious flooding in Myanmar destroyed about 1.2 million ha of paddy, driving up food prices and general inflation. By early September, the government was forced to request emergency food relief from the United Nations. To increase paddy production and possibly exports, in November the government replaced its system of procuring paddy directly from farmers under a quota system with a system of purchases through a sealed tender bidding process. Agriculture’s share in Nepal’s GDP has fallen to about 41 percent, but still about 80 percent of the total labour force depend on agriculture for their livelihood. Therefore, the 3 percent growth in agricultural production in 1997 helped a large share of the population. Implementation of the Agriculture Perspective Plan is expected in part to offset the effects of unfavourable weather in early 1998, but agricultural growth is still likely to decline. In Pakistan, agricultural production growth in 1997 was 2 percent, as unseasonable rainfall and cotton pests and viruses compounded the effects of low productivity. The production of major crops such as cotton, sugar cane and wheat declined, while reduced cotton production also contributed to a drop in exports. To improve performance in the agricultural sector and reduce agricultural imports, the government announced a comprehensive package of incentives, including higher product support prices, lower input prices, an expansion of agricultural credit and improved irrigation and drainage facilities. In the Philippines, 1997 agricultural growth was just 0.4 percent, as it was hampered by severe droughts brought on by the El Ni±o phenomenon and the fall in the peso. Agricultural employment, at about 40 percent of the labour force, is likely to fall in 1998 when the full impact of El Ni±o finally hits. Aided by favourable weather, Sri Lanka’s agricultural sector recovered in 1997, with a 7 to 8 percent growth in production. Agricultural exports rose in value terms as a result of higher tea and coconut prices, and expanded slightly in volume as well. Agricultural production in Thailand was also hit by El Ni±o-related drought, and only rose marginally in 1997, with cereal output actually declining by an estimated 3 percent. The country’s strong economic performance in recent years until mid-1997 has increased and diversified consumer demand for agricultural products. At the same time, agricultural exports, particularly rice, sugar, fisheries products, rubber and poultry meat have contributed to the rapid economic growth. The current financial crisis is threatening this synergistic growth, however, by crimping domestic demand and raising the prices of imported agricultural inputs. On the other hand, the depreciation of the baht may increase Thailand’s export competitiveness, particularly for commodities with a low import content. The production of rice in Viet Nam, where it is the staple food, dominant
agricultural activity and an important export, was spared the worst effects of the El
Ni±o phenomenon, and agricultural output increased by 1.5 percent. The prices of rice and
other foodstuffs declined in the first half of 1997, contributing to a decline in
inflation. Issues and prospects for regional agriculture
As noted above, the unexpected Asian financial crisis is taking a heavy toll on the region, and particularly on Indonesia, Malaysia, the Philippines, the Republic of Korea and Thailand. The impacts will be felt throughout these economies, including their agricultural sectors. Currency depreciations and income contraction are reducing import demand, for instance, although the currency depreciations and greater availability of exportable surplus resulting from reduced consumption should boost export competitiveness. At the global level, these effects are likely to be seen in the markets for maize, bovine meat, soybean meal, temperate fruits, cotton and hides and skins, where Asia’s imports are likely to be reduced, and in the region’s exports of tropical fruits and rubber. Attempts to predict the quantitative changes likely in the future are complicated by the fact that the crisis has reduced the availability of trade financing in the countries most affected, although donor countries and multilateral financial institutions have been trying to ease the burden with export credits and loans to the region’s export-import banks. Among cereals, the impact of the crisis is expected to fall mainly on coarse grains, and particularly maize, as the contraction in meat demand will lower import demand by an estimated 2 to 3 million tonnes. Imports of wheat, a staple food in the region, are expected to contract by not more than 1 million tonnes, with a minimal impact at the global level. Likewise, the global rice market is not expected to be affected much by the financial crisis, although El Ni±o-induced droughts may increase imports by Indonesia, Malaysia and the Philippines in 1998. This may work to the benefit of Thailand and possibly Viet Nam, although pressure on the US dollar price of rice will be moderated by the depreciation of the Thai baht. Exports of cassava and its products are unlikely to increase significantly, as poor weather has reduced the exportable surplus.
The financial crisis is expected to have the largest impact on the region’s demand for meat, particularly bovine meat, which has high price and income elasticities of demand. The reduced demand for bovine meat in the region may be sufficient to weaken world prices in 1998 and even more so in 1999 if the crisis appears to be prolonged. The regional demand for pig and poultry meat is largely satisfied by domestic production, so little effect on these global markets is expected although there may be some trade diversion owing both to changes in demand and to changes in competitiveness, such as the recent inroads made by Thailand in Brazil’s poultry sector. Regional trade in sheep meat also represents just a small share of global trade and is unlikely to influence world markets except perhaps through substitution effects as relative prices of other meats change. Vegetable oils are staple foods in the region and their consumption is therefore unlikely to be significantly influenced by the region’s income and price changes. But with reduced demand for meat, there will also be reduced demand for oilmeals and oil cakes, which are important feedstuffs. Soybean meal from China and India may be in greater demand in the region than relatively more expensive meal from Brazil or the United States. Cheaper or domestically produced palm kernel and copra meals could also be substituted for soybean meal. At the global level, the impacts on oilmeal trade are likely to be primarily in terms of trade diversion, since Southeast Asia’s enhanced competitiveness will have little effect until exportable surpluses resume. Reduced demand for dairy products in the region will primarily affect milk powder
exports from Australia and New Zealand. The region’s reduced demand for tropical
beverages is expected to have little impact on world markets since the five most affected
countries together account for only 1 to 3 percent of world imports. Tea, with low price
and income elasticities of demand, will probably be affected the least, while demand for
coffee is expected to fall sharply in the region but only slightly at the global level.
The 1998 Indonesian coffee harvest is reported to be reduced by 30 percent owing to El
Ni±o-induced drought but, when more favourable weather returns, the country’s
increased competitiveness can be expected to boost exports, assuming trade financing is
available by then. The region’s demand for cocoa beans for processing is expected to
remain strong, given its increased export competitiveness and large installed processing
capacity. Imports of fruits and vegetables, which have high price and income elasticities, can be expected to decline significantly, particularly those of temperate fruits and vegetables from outside the region. On the other hand, exports of tropical fruits are expected to increase, possibly displacing some African and Latin American exports in European and North American markets. In terms of agricultural raw materials, imports of cotton by the affected countries can be expected to decline, with some impact on world prices. Demand for natural rubber has fallen with the drop in demand for automobiles, while the greater availability of rural labour is expected to increase supply, thereby depressing world rubber prices. Global demand for hides and skins will be negatively affected, particularly in the world’s second largest importer, the Republic of Korea, where reduced access to working capital and foreign exchange should more than offset enhanced export competitiveness for final products. Whether or not the numerous small (and the few greater) effects of the regional
crisis on world markets become more substantial will depend on a number of factors. Chief
among these are the breadth and depth of the crisis, which is not yet fully apparent, the
future evolution of exchange rates and trade policies and the ease with which credit flows
may be resumed, particularly for companies of processed products. The speed and extent of
recovery will vary from country to country, but should nevertheless help to place future
economic growth on a more solid institutional foundation. Experiences in fiscal decentralizationAs in other regions, several Asian countries have endeavoured to take advantage of decentralization as a means of fostering regional and rural development. A frequent reason – reported worldwide – as to why such efforts give unsatisfactory results is a lack of financial decentralization, which is needed to back up the devolution of responsibilities to levels below central government. In this respect it is interesting to note the different experiences of Pakistan and China in implementing fiscal decentralization (see Boxes 6 and 7).
Major reforms aimed at decentralization have been undertaken in
China since 1979, and fiscal decentralization has been a part of these moves, involving
financial arrangements between government and state enterprises and between central and
local governments. In China’s case, there is also evidence of the specific impact of
fiscal decentralization on rural development. This, together with the impact of other
reform measures on rural development, is the subject of an empirical study reviewed in Box
7. MALAYSIAMAP 6General characteristicsMalaysia is a diverse country, in both its geography and its people. Its land area of 32 million ha is divided between the southern peninsula of Southeast Asia (West Malaysia) and the states of Sarawak and Sabah (East Malaysia), which are parts of the island of Borneo in the South China Sea. Almost 70 percent of the land area is forested, much of it is mountainous and a very small portion consists of irrigated cropland. Malaysia has an equatorial climate with a high rainfall during the two monsoon seasons. Malaysia’s neighbours are Thailand, which is to the north of West Malaysia;
Singapore, which lies just across the narrow straits below the southern tip of West
Malaysia; and Borneo, an Indonesian state. Thanks to this location, Malaysia is a country
of ethnic, religious and cultural diversity. In mid-1996,11 it had a population of 21.2 million
people, of whom 12 million were Malay, 5.3 million Chinese and 1.5 million Indian. Also
included are about 1.3 million migrant workers, originating mainly from neighbouring
Southeast Asian countries. Historical perspective on economic developmentMalaysia has been one of the world’s economic success stories for the last three decades: in 1970, it had a GDP per caput of only 1 049 Malaysian ringgit ($M) ($342); by 1997, per caput income had risen to an estimated $M 11 303 ($4 316).12 This phenomenal economic growth was accompanied by a sharp drop in the poverty rate which fell from 38 percent of the population in 1970 to 15 percent by 1995.13 Hard-core poverty (as defined by the World Bank’s lower poverty line) represented only 2.1 percent of the total population, while about 88 percent of all urban households and 72 percent of rural households had access to electricity. Moreover, at least two-thirds of rural households and 96 percent of urban households had access to such necessities as safe drinking-water, health care and education facilities. This record of economic achievement owes much to a series of economic policy decisions, beginning with the New Economic Policy (NEP) initiated in 1971. The broad aim of the NEP was to eradicate poverty across all population groups and to ease ethnic tensions by reducing occupational barriers based on ethnicity. Other policy objectives were to increase the productivity of the rural sector by ensuring the adoption of modern techniques and the provision of better facilities; facilitate intersectoral labour mobility through education and training; and provide subsidized social services to low-income families.14 Finally, Malaysia shifted its trade policy from import substitution towards increased exports of existing export commodities – rubber, petroleum, tin, palm oil, cocoa, forestry products and pepper. Tax incentives were created to encourage investment in basic export industries and to develop downstream processing capacity which would lead to greater exports of higher-value products.
The result of these policy moves has been the achievement of major macroeconomic goals since 1971. Malaysia has seen increased incomes and wages, stable prices, high savings and investment rates, an economy increasingly oriented towards manufactures and services, and increasing trade and diversification of exports. Rapid economic growth, which averaged 6.7 percent annually from 1970 to 1990 and more than 8 percent annually from 1990 to 1996, has occurred without igniting inflation. Prices have increased by about 3 percent per year since 1980, well below the rates of many other fast-growing economies. The financial crisis in 1997 has put greater pressure on prices, as imports have become more costly. Even so, private sources project an increase in consumer prices of 7.5 percent in 1998 and just under 5 percent in 1999.15 Table 5 shows the structural changes in the Malaysian economy from 1970 to 1995, during which time agriculture declined in importance from 29.9 percent of GDP to 13.6 percent. Although agriculture achieved an annual growth rate of more than 4 percent during the two decades up to 1990 and a rate of 2 percent in the 1990s, other sectors grew much faster. Manufacturing, finance, transport and communications and government services all grew faster than the agricultural sector, and hence accounted for a greater proportion of GDP in 1995. Two decades of strong growth have led to some pressure on productive resources in Malaysia, principally caused by a tightness in labour markets, leading to rising real costs of skilled and unskilled labour and a shift of some manufacturing to neighbouring countries with lower labour costs. Labour turnover has been high, as workers have moved from one to another higher-paying job, and average pay was rising faster than productivity rates before the financial crisis.
|
||||||||||||||||||||||||||||||||||||||||||||||||||||||||||||||||||||||||||||||||||||||||||||||||||||||||||||||||||||||||||||||||||||||||||||||||||||||||||||||||||||||||||||||||||||||||||||||||||||||||||
| Sector | 1970 |
1980 |
1990 |
|||
(million $M) |
(%) |
(million $M) |
(%) |
(million $M) |
(%) |
|
| Agriculture, forestry, livestock, fisheries | 5 949 |
29.9 |
14 829 |
18.7 |
16 406 |
13.6 |
| Industry | 6 423 |
32.2 |
33 368 |
42.2 |
83 289 |
69.2 |
| Services | 7 507 |
37.7 |
31 954 |
40.4 |
50 358 |
41.9 |
| GDP at factor cost | 19 929 |
79 103 |
120 316 |
|||
Agriculture, construction and domestic services were most affected by the shortage of unskilled workers relative to the growing demands. The response was an influx of a foreign labour force, mostly drawn from Bangladesh, Indonesia and the Philippines. In 1995, Malaysia issued a total of 650 000 work permits16 but there was estimated to be an equal number of illegal foreign workers in the country.17
High wages led to the erosion of Malaysia’s price competitiveness in international markets.
Higher wages in some sectors spilled over into others, and Malaysia saw its price competitiveness eroded in international markets. Labour shortages and higher costs eventually forced some industries to shift manufacturing activities to neighbouring countries such as Indonesia and the Philippines where there is a greater abundance of low-wage labour. The recent currency devaluation has, for the moment, relieved some of the cost pressure in some of these industries. Nevertheless, among the low-wage countries, the ringgit has depreciated only against China’s renmingbi; it has maintained its value against the Thai baht and the Philippine peso and appreciated sharply against the Indonesian rupiah.
Malaysia’s position has shifted from that of a low-cost supplier of
labour-intensive, basic manufactured products to a country in the process of developing
the human capital and technical capacity to produce goods and services with a higher
value-added component.
Malaysian agriculture, broadly defined, includes perennial and food crops as well as livestock, fisheries and forestry. Table 6 shows the value added by each of the major sectors during the first half of the 1990s. The perennial commodities account for the largest share of Malaysia’s agricultural output with 57 percent of the total value added for agriculture in 1995. Within this group are three major export commodities, rubber, palm oil and cocoa. Palm oil is the largest by far and was the only one of the three to have a positive growth rate for the period shown.
The food commodity group accounted for 21 percent of value added in agriculture
in 1995, with fisheries being the most important, followed by livestock and paddy. Each
experienced positive growth in the period. Forestry products, as measured by the output of
sawlogs, experienced a 4 percent average annual decline. Miscellaneous crops, including
tobacco, pineapple, other fruits and vegetables, sago, etc., accounted for roughly 10
percent of agricultural value added and, as a group, grew faster than any other major
grouping over the period.
|
1990 |
1995 |
1995 share |
Average |
| Perennial commodities | 8 585 |
9 365 |
57.1 |
1.7 |
| Rubber | 2 043 |
1 745 |
10.6 |
-3.1 |
| Palm oil | 5 312 |
6 801 |
41.4 |
5.1 |
| Cocoa | 1 230 |
819 |
5.0 |
-7.8 |
| Food commodities | 2 738 |
3 502 |
21.3 |
4.9 |
| Paddy | 600 |
666 |
4.1 |
2.1 |
| Livestock | 604 |
838 |
5.1 |
6.8 |
| Fisheries | 1 534 |
1 998 |
12.2 |
3.7 |
| Forestry (sawlogs) | 2 315 |
1 876 |
11.4 |
-4.1 |
| Miscellaneous | 1 189 |
1 663 |
10.1 |
6.7 |
| Total | 14 827 |
16 406 |
100.0 |
2.0 |
1 In 1978 prices.
Source: Government of Malaysia, Economic Planning Unit. 1991 and
1996. Sixth Malaysia Plan, 1991-1995 and Seventh Malaysia Plan, 1996-2000. Kuala Lumpur,
Percetakan Nasional Malaysia Berhad.
Expansion of the total area planted to perennial crops in Malaysia slowed during the 1990s as land availability was exhausted.
Figure 28 shows the change in area planted to the three major perennial crops in Malaysia since 1980. (Data are divided between estate and smallholder production regimes, which are discussed under the section Land allocation policies, p.165.) The total area planted in perennial crops grew from 3 million to 4.3 million ha between 1980 and 1990, but expansion slowed during the 1990s as limits on land availability were reached. By 1995, total area planted to the three crops was only 4.5 million ha. Oil palm area doubled during the 1980s and has maintained that pace of expansion during the first half of the 1990s. The overall slowdown is due to an absolute decline in area planted to the other two crops.
Malaysia is the world’s largest producer and exporter of palm oil.
Oil palm covers about one-third of Malaysia’s cultivated area, with 1.9 million ha on the peninsula and 600 000 ha in Sabah and Sarawak. Most of the new land for oil palm is coming from eastern Malaysia because very little land for agricultural development is available on the peninsula. Production of crude palm oil reached 7.8 million tonnes in 1995, accounting for 51 percent of world palm oil production and 8.3 percent of world oils and fats output. Malaysia is the world’s largest producer and exporter of palm oil; the country’s exports account for about 65 percent of world palm oil trade and, in 1995, its earnings from exports of palm oil and derived products amounted to almost $M 13 billion.
The rapid development of the palm oil industry may be attributed to good growing conditions and increasing prices relative to other export commodities. Favourable climatic conditions in Malaysia have made the crop easily adaptable from its origin of West Africa and the tropical regions of the American continent (its natural habitat). This, combined with a strong global demand for fats and oils over the last two decades, has provided a tremendous economic incentive to expand production.
Although land is being converted out of rubber, there are large areas where other crops are not economically viable and so rubber remains the most profitable choice.
The success of oil palm stands in sharp contrast to the other two major perennial crops, rubber and cocoa. The production of natural rubber in 1995 was only 1.1 million tonnes – down from a peak of 1.6 million tonnes in 1976. Rising labour costs have hit the estates especially hard, and some have moved into oil palm because of its higher returns. Figure 28 shows the decline in land area planted to rubber among the estates. There has been less change in smallholder area planted to rubber as the crop is well suited to smallholders who can devote part of their household labour to tapping and maintenance of the rubber trees while working full time in other enterprises. Thus, smallholders are less affected by the tight labour markets. Rubber is and will remain an important crop in Malaysia, however. Exports still accounted for more than $M 4 billion in sales in 1995 and, although conversion of land out of rubber will continue, there are large areas where other crops cannot be planted economically and where rubber is likely to be the most profitable choice.
Cocoa (and its products) is Malaysia’s third most important export crop with
total sales in 1996 of $M 594 million. Cocoa was one of the crops identified in a
diversification strategy of the 1970s when falling rubber and palm oil prices led the
government to seek ways of increasing the earnings of agricultural producers, especially
smallholders. Throughout the early 1990s, a combination of falling world prices for cocoa,
rising labour costs, and a decline in yields associated with the cocoa borer pest led to a
decline in area planted to cocoa. By 1996, production had fallen to 120 000 tonnes (dry
bean basis) from a peak of 247 000 tonnes in 1990.19 Seventy percent of Malaysia’s
cocoa production originates in Sabah.
AREA PLANTED TO PERENNIAL CROPS IN MALAYSIA
Three sets of policies have influenced the growth of the perennial crops – land allocation policies, trade policies and, recently, immigration policies (which is mentioned in the section on Labour issues, p.170).
Land allocation policies. Malaysia’s three major perennial crops – palm oil, rubber and cocoa – are produced by the estate and smallholder subsectors. The latter includes independent producers on private holdings as well as participants in government land development schemes. The estate subsector largely comprises privately owned farms using hired (often foreign) labour and modern technology and usually owning some of the necessary processing and/or refining facilities. Many of these estates are under publicly traded corporate ownership.
BOX 8 MALAYSIA’S LAND ALLOCATION PROGRAMMES
There are three major allocation programmes: the Federal Land Development Authority (FELDA), the Rubber Industry Smallholders’ Development Authority (RISDA) and the Federal Land Consolidation and Rehabilitation Authority (FELCRA). The aims of each are basically to encourage the production of export crops, settle unused land with poor rural households and form efficient production units by uniting smallholders. FELDA is the largest and oldest resettlement scheme. Initiated in 1956, its projects now cover 883 000 ha and support 109 000 households. Oil palm is planted on 76 percent of the land, rubber on 18 percent and sugar cane, cocoa and other minor crops on the remainder. The basic approach is to identify a suitable site of approximately 2 000 ha for the settlement of 400 families. At this size, the site qualifies for the provision of essential rural services, including a clinic, a school and a police station, and the development of rural roads, electricity and piped water can be justified. Settler selection requirements are that applicants be between 21 and 45 years of age, married – preferably with children – and physically fit. Prospective settlers must be landless, but have an agricultural background. FELDA hires a contractor to clear the land and plant the trees, often stipulating that the contractor must hire settlers to do part of the work. Settlers receive a subsistence allowance until the trees mature – usually after three to four years – at which time each settler is given a 4 ha plot. Settlers normally work in teams to maintain and harvest the product from a group of holdings. Thus, settler’s earnings are a function of both their team’s efforts and the productivity of their own plot. Settlers are obligated to use a portion of their earnings to pay back a 15-year loan covering the cost of establishing the project. When the loan is paid off, they are given title to the land. Land allocation efforts are affected by three current issues: • With a lack of available land on peninsular Malaysia, new land development projects are focused on Sabah and, to a lesser extent, Sarawak. • Agencies have very high administrative costs, as the number of settler families per FELDA officer has been estimated to be 12 to 1. • Land schemes are no longer attracting settlers because of the availability of
alternative employment. 1 T.S. Bahrin. 1988. Land settlement in Malaysia: a case study of the Federal Land Development Authority Projects. In A.S. Oberai, ed. Land settlement policies and population redistribution in developing countries. New York, Praeger.
|
Smallholders often farm part time to supplement other income sources and reduce or temporarily abandon farming activities when prices are low.
Smallholders often farm part time to supplement other income sources and, when prices are low, reduce or temporarily abandon farming activities so as to increase their work effort in other areas. Hence, yields in the smallholder subsector tend to fluctuate more with economic conditions.
However, even when prices are strong for the perennial crops, smallholder yields are much lower than those in the estate sector. Smallholder yields are 60 percent of estate yields for rubber and 70 percent of those for oil palm. This yield disparity is a major concern for the government whose assistance in the form of land settlement schemes (see Box 8) and extension services is directed almost exclusively at the smallholder sector. Other assistance, such as replanting grants and government loans, while available to all producers, tends to be more generous for smallholders.
The issue of the disparity between estate and smallholder productivity continues to be a concern for policy-makers, particularly since a large portion of the smallholders are on government land schemes.
The lost potential production from the failure to increase yields in the smallholder farm subsector is more costly to the economy now that the country is facing an economic contraction. However, although many smallholders had reduced their farming effort in response to better income opportunities elsewhere, they may now reverse their initial shift away from farming, since a diversification of income sources could be their best protection against the aftershocks of the economic decline.
Estates were quicker than smallholders in shifting area out of rubber and cocoa and into oil palm in the early 1990s. This may also be an indication of the rigidities in the federal land schemes which prevent individual smallholders from acting without the consensus of others within a project. Whatever the differences in incentives, the smallholder share of rubber and cocoa area has nevertheless become more dominant in the last 15 years. In addition, a growing proportion of estate owners have shifted completely out of agricultural production and into other economic activities altogether, such as manufacturing and tourism. Larger landowners have more choices than smallholders when investing in alternative activities.
A final difference between the two production regimes is that the difficulty of attracting hired labour to the estates seems to have resulted in about 1 million ha (5 percent of cultivable land) remaining idle.
Trade policies. Palm oil is Malaysia’s second largest export after machinery products, accounting for 7 percent of export earnings. Palm oil has been subject to export taxes throughout its 50-year commercial history in Malaysia. In the 1950s and 1960s, the tax was a flat 5 to 7.5 percent of the value of the export, but in the 1970s the government changed the tax structure to favour the development of downstream processing. It put a high tax on exports of crude palm oil (CPO) while reducing the tax levied at each level of processing. Virtually none of the palm oil that Malaysia exported in 1997 was CPO. Initially, the industry overreacted to the processing incentives and developed a huge overcapacity in processing and refining facilities in the mid-1980s which depressed processing margins. The closure of some plants, coupled with a gradual increase in production as the area under oil palm expanded, has alleviated the problem.
The government also supported the production of palm oil by allowing the use of rubber replanting grants for planting oil palm. The grants for replanting oil palm amounted to $M 4 447 ($1 710) per hectare for holdings of less than 4.05 ha and $M 3 459 ($1 330) per hectare for larger holdings.
Many of the trade policies for palm oil have also been applied to rubber, which is Malaysia’s oldest commercial export crop and consequently has a policy history dating back to the British colonial administration at the turn of the twentieth century. An export tax on rubber was introduced in 1907 and remained in place until it was abolished in 1991 in order to lighten the tax burden on an already contracting industry.
Rubber trees have an economic life of 25 years, after which their latex production begins to decline. The government’s policy is designed to encourage the replacement of older trees with newer varieties by providing replanting grants. These grants are available to both smallholders and estates and are intended to cover the cost of replacing trees as well as some of the income forgone by farmers while waiting for the new trees to mature (four to seven years). In 1995, grants were $M 6 177 ($2 375) per hectare for holdings of less than 4.05 ha and $M 4 200 ($1 615) for larger holdings. Payments were reduced if rubber was planted with other crops.
Both replanting and research grants for rubber are funded by a duty levied on each kilogram of rubber exported – this duty was maintained after the export tax was abolished. The management and utilization of the proceeds are under the control of the Rubber Industry Smallholders’ Development Authority (RISDA).
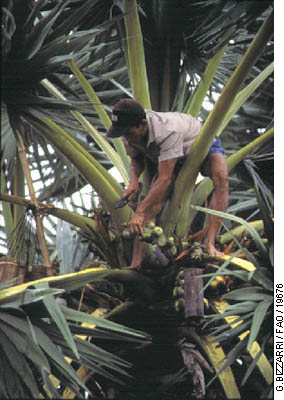
Tending trees on a palm plantation
Palm trees produce many exportable products, e.g. palm oil, of which
Malaysia is the world’s largest exporter.
Until 1994, the trade policy for cocoa had been one of protection against competition from foreign imports. The rapid increase in cocoa production in the 1980s was partly due to policies providing support to the industry through subsidies to smallholders and a 15 percent import tariff. The tariff was abolished in 1994 so as to facilitate the entry of Ghanaian cocoa bean imports, as these are blended with Malaysian beans to improve the chocolate flavour. This policy change was to facilitate downstream processing activities of cocoa beans into cocoa products.
The government has also implemented regulatory measures, including compulsory grading to ensure standardization and quality in Malaysian cocoa beans. These measures will contribute towards the creation of a market “niche” for Malaysian cocoa beans. Cocoa butter made from Malaysian cocoa beans has a higher melting temperature than cocoa butter from other countries, an advantage that is expected to help the industry remain competitive in the international market.
A continual decline in the size of the agricultural workforce has resulted in a sectoral labour shortage in Malaysia.
Labour issues. Labour has been a limiting factor to the expansion of perennial crops in Malaysia, as a continual decline in the size of the agricultural workforce – reflecting a natural progression of the development process – has resulted in a sectoral labour shortage. The share of agricultural employment in Malaysia’s total workforce declined from 26 percent in 1990 to 18 percent in 1995.
Between 1980 and 1995, 20 percent of the country’s rural population migrated to the cities and, by 1995, 55 percent of the country’s population was classified as urban. Most of the shift was driven by the availability of higher-paying employment opportunities outside agriculture. During most of this 15-year period, real wages in agriculture were stagnant. Eventually, in 1995 workers on rubber and oil palm estates obtained a 30 percent increase in wage settlements, but this may be considered “too little, too late” for drawing young members of the workforce back to agriculture.20 In addition to raising wages, the sector has increased mechanization and land consolidation in an effort to reduce the need for labour.
Malaysia’s immigration policy is of crucial importance to the estate subsector, as agriculture employs at least 250 000 foreign workers (with permits), which is roughly one-third of the legal foreign workers present in the country. There is also likely to be a large number of illegal workers employed in the sector but the size of this group is not known. A change in immigration rules or a tightening of enforcement could reduce the foreign labour available to the sector and put further upward pressure on wages.
As already mentioned, the labour issue is one of the most intransigent problems facing the perennial crop subsector in Malaysian agriculture. Rubber, palm oil and cocoa are labour-intensive crops: labour accounts for 40 to 60 percent of perennial crop production costs and is also significant in annual crop production. Low-cost foreign workers hold down wage increases and allow plantations to remain competitive while still using their current production practices. At the same time, however, low wages are a disincentive to the development and adoption of labour-saving techniques and equipment. This is the dilemma faced by sectoral and macro policy-makers. As the scope for improving labour productivity is limited, especially in the short term, what both the industry and the government fear is that tighter restrictions on the use of foreign labour will simply force production to move to other countries.
The labour dilemma is slightly different for the smallholder sector, much of which is on government land schemes. The major success of these land schemes, which were established as part of a social policy to alleviate rural poverty, has been the opening up of new land, the redistribution of income and the delivery of government services to the rural poor. With the exodus of workers in search of better-paying employment outside agriculture, the government land schemes have been left with an ageing population of workers. In 1990, one-third of farm household heads were more than 55 years old and two-thirds were more than 46 years old.
The two largest land settlement schemes, the Federal Land Development Authority (FELDA) and RISDA, are already under pressure to reform because the size of the administrative bureaucracy is too large for the number of settlers. Their original mandate is less relevant in an economy with a labour shortage and a lack of suitable land for expansion. The current conditions suggest that these programmes may have accomplished their original goals. Reforms are being considered, but the economic crisis will make it difficult for the government to take any steps that might reduce the sizeable administrative staff of such programmes until the economy improves.
The economic crisis has complicated the labour issue because the government, concerned with the growing number of redundancies, has become more intent on reducing the number of foreign workers in Malaysia. At the same time, as a result of strong export demand, oil palm producers are struggling to increase output to take advantage of the high prices on the world market. The impact of the financial crisis on the non-agricultural sector may mitigate, at least temporarily, the labour shortage in agriculture.
The increase in the price of palm oil may help to retain labour in the
smallholder sector if relative wages also continue to rise, especially since the
opportunity cost of leaving agriculture has recently increased, farm prices have risen and
job opportunities outside the sector have diminished. However, many of those who remain
are part of an ageing farm population and, even with higher agricultural prices,
agriculture is not likely to persuade many outside the sector to return to farming. Even
if the financial crisis continues for two or three years, it will at best bring only a
temporary slowing of the long-term decline in the agricultural workforce.
Forestry has traditionally been one of the major sources of income, export earnings and employment in the Malaysian agricultural sector. Taxes and royalties on forestry products have been, and continue to be, a major source of revenue for state governments, particularly those with large forested areas such as Sarawak. In 1990, sawlogs accounted for a value added of $M 2.3 billion (in 1978 prices) or 15.6 percent of the valued added to agriculture, meaning it was second only to palm oil. Forestry’s annual contribution to value added followed a downward trend until 1997, when a 3.4 percent rise in production was expected because of a partial lifting of the export ban on raw logs and also because of an increased processing capacity.
Malaysia is the world’s leading producer of tropical sawlogs. Forested areas in Malaysia totalled 18.5 million ha in 1992, the last year for which complete data are available. Of this, the peninsula had 5.5 million ha, Sabah 4.2 million ha and Sarawak had 8.8 million ha. Although Sarawak has the largest forested area, the infrastructure for accessing that area is undeveloped and the costs of exploiting the forest resources are much higher than on the peninsula. Nonetheless, 55 percent of the recent increases in production have come from Sarawak, and the government has expressed concern about concession holders not replanting harvested areas.
There are three classifications of forested area – state lands, permanent forest estate (PFE) and parks and reserves. Logging is not permitted on the 1.4 million ha of park land, as this area is restricted to recreational and conservation uses. The difference between state and PFE lands is in how they are administered. State lands are under the administration of the individual states, whereas the logging on PFE lands is administered by the Forestry Department and must follow stricter guidelines established at the federal level. State lands account for only 0.2 million ha in the peninsula and 0.6 million ha in Sabah, where virtually all the areas for logging are in PFEs. Sarawak, on the other hand, has 3.9 million ha (or 45 percent) in state lands.
Very little of Malaysia’s forest area is virgin forest. The largest proportion is in Sarawak where about one-quarter of the area is undisturbed. Because they have not previously been logged, virgin forests have a higher yield of higher-quality trees than other forested areas and they are also richer in biodiversity. Logging in Malaysia is done on a selected basis (as opposed to the clear-cutting carried out in some temperate climates). The Forestry Department monitors harvesting and, once an area is harvested, prohibits its use for further production until a sufficient number of trees have grown to the minimum size required to permit a second harvest.
Employment, government revenue and conservation are the three objectives of Malaysia’s forestry policy.
Forestry policy environment. Forestry policy has been designed to
meet three objectives which are not entirely compatible: employment, government revenues
and conservation. Logging provides employment and income as well as the principal raw
material required by the country’s expanding wood manufacturing industry. In states
where logging is a major activity, revenues collected from the licensing of logging
activities provide a significant share of the state’s operating revenue. At the same
time, there is greater recognition of the fact that current exploitation of forest
resources exceeds levels that can be sustained over
the long term.
Key forestry policies fall into two areas: logging and export. A sustainable annual cutting area for PFE land is set at the federal level and then allocated by state. The states then follow federal guidelines in issuing licences. Logging companies must pay two fees: a royalty based on the volume of logs cut and a premium based on the area licensed for cutting. Both federal and state authorities face difficulties in enforcing the log harvesting regulations. Eventually, the goal is to reach a sustainable level of cutting, balancing reforestation with harvest rates; however, logging is usually conducted in remote areas and there are large financial incentives to circumvent taxes and regulations.
Export policies differ between the peninsula and Sabah and Sarawak, with
differential taxation of raw logs and processed wood products. The peninsula has banned
the export of logs since 1992, while Sabah instituted the ban two years later with the
dual objectives of preserving its biologically valuable rain forest and encouraging
value-added wood manufacturing. However, Sabah partially lifted its ban in 1997. Sarawak
allows log exports but imposes an export tax, while the peninsula imposes export duties on
timber products, including sawntimber, plywood and veneer.
Fish contributes about two-thirds of all animal protein consumed by Malaysians and the industry employs about 1.6 percent of the economically active population. Production totalled 1.3 million tonnes in 1995, of which 1.2 million tonnes were marine catch and the remaining 0.1 million tonnes were from aquaculture. Production expanded by 30 percent between 1990 and 1995, with one-quarter of the increase coming from aquaculture, which had previously been negligible. The increase in the production of marine fisheries is attributed to an increase in the deep-sea catch as inshore fish resources continued to decline.
Fish imports are mainly from Thailand, the bulk of which are low-grade fish species. Imports help bridge the gap between supply and demand for low-grade species and, to some extent, stabilize domestic fish prices. Exports are mainly to Singapore and are confined to high-quality fish species and prawns.
Fisheries policy. Government intervention in the fishery sector is
extensive. The Fisheries Act of 1985 was enacted to curb overexploitation of fishery
resources, minimize conflict and promote equality between coastal and trawl fishermen. The
act defines a zoning policy which allocates fishing grounds by types of fishing gear, size
of vessel and ownership status of vessel. The act bans all trawling activities in waters
that are five miles or less from the coast. The government has also sought to promote an
increase in fish catch, primarily by encouraging deep sea fishing and aquaculture
development. It has made low-cost loans available for the purchase of deep sea fishing
equipment and invested in deep sea landing facilities.
Malaysia is dependent on imports for all major food items except vegetable oils.
Malaysia is dependent on imports for all major food items except vegetable oils. Although it is self-sufficient (or a small net exporter) in fruit, poultry, eggs and pork, it is heavily dependent on imported feedstuffs. Before examining the details of how Malaysia meets its food needs, some information is provided on the Malaysian food budget.
In 1993/94, Malaysians spent 23 percent of their average monthly household income on food for home consumption and an additional 12 percent on purchases of food and beverages away from home. Figure 29 shows how consumers allocated their at-home food expenditures.21
Fish is clearly the largest expenditure, accounting for almost 20 percent of the food budget. A number of other items – rice, other cereals, poultry, fruits, vegetables and other foods – each account for 10 to 12 percent of expenditures. Pork, beef, lamb, eggs, milk and fats are of less importance.
Table 7 shows Malaysia’s balance of supply and use for major food groups. Poultry and pork are almost totally dependent on imported feedgrains as well as imported protein meal, which is either imported directly or produced from imported soybeans. Although Malaysia is technically self-sufficient in marine fish, it is still heavily involved in the fish trade, exporting high-value fish and importing lower-value fish for the domestic market. Fruits and vegetables have a similar pattern of supply and use, with Malaysia exporting tropical products (the largest share going to Singapore) and importing temperate products. For beef and mutton, Malaysia is almost entirely dependent on imports. High-quality beef is produced domestically and imported from Australia, New Zealand and the United States, while the greatest volume of imports is of frozen, lower-quality beef from India. Mutton and lamb imports come primarily from New Zealand.
Food policies. Except for rice, food commodities are largely free
of government intervention, although at the retail level, the government does control
prices of a set of basic staples, including rice, wheat flour and cooking oil. With the
recent devaluation of the ringgit, this has put wheat millers in a difficult position.
After buying the raw product on the world market in US dollars, they then have to sell
their product in the Malaysian market according to ringgit prices controlled by the
government. The government realizes the need to allow these companies to raise retail
prices but would like to limit the rise in order to minimize the effects of the financial
crisis on low-income consumers. Cooking oil and rice do not present the same problem
because they are supplied primarily from domestic production.
Production |
Imports |
Exports |
Domestic use |
Per caput use |
Self-sufficiency |
|
| Fish | 1 065 |
261 |
248 |
1 078 |
52.1 |
.99 |
| Poultry | 687 |
6 |
8 |
684 |
33.0 |
1.00 |
| Pork | 283 |
- |
- |
283 |
13.7 |
1.00 |
| Beef | 19 |
68 |
1 |
86 |
4.2 |
.22 |
| Mutton | 1 |
10 |
- |
11 |
0.5 |
.06 |
| Fruit | 2 200 |
259 |
242 |
2 217 |
107 |
.99 |
| Vegetables | 844 |
411 |
250 |
1 005 |
48.6 |
.84 |
| Riche | 1 372 |
428 |
2 |
1 797 |
86.9 |
.76 |
| Feedgrains | 45 |
2 343 |
- |
2 436 |
n.a. |
.02 |
| Protein meal 1 | 1 839 |
548 |
1 340 |
1 064 |
n.a. |
n.a. |
| of which: |
|
|
|
|
|
|
| - PKC | 1 360 |
1 332 |
40 |
n.a. |
n.a. |
|
| - Soymeal | 432 |
500 |
5 |
932 |
n.a. |
|
1 Palm kernel cake (PKC) is not used in domestic feed rations; soymeal production
is entirely from imported soybeans.
Rice policy. Since rice is an important staple in the Malaysian diet, the government has taken measures to ensure that the country maintains at least a 65 percent level of self-sufficiency in rice. The government supports rice farmers by several means, including input subsidies and output incentives. Furthermore, it has assisted paddy farmers in the application of pest control methods, farm management and the consolidation of small farms. Each rice producer is eligible for a fertilizer grant and for loans from the Bank Pertanian Malaysia at a virtually interest-free rate. When the crop is produced, the government guarantees producers a price of $M 496 (1995 value) per tonne of paddy. In addition, each producer is eligible to receive a government “income” supplement.
Malaysia’s long-term decline in rice output is the result of land conversion from rice paddies to more lucrative uses.
MALAYSIA: CONSUMER FOOD EXPENDITURES
All these support policies have served only to slow the long-term decline in rice
output, which has been relatively stagnant at about 2 million tonnes per year since 1996.
The trend is the result of land conversion from rice paddies to more lucrative uses.
Malaysia imports about one-fifth of its domestic needs from Thailand and Viet Nam, which
produce surpluses in rice and have lower production costs than Malaysia.
Malaysian agriculture already faced challenges before the onset of the financial and economic crisis in the second half of 1997. A reduction in available labour, the disparity in estate and smallholder yields and reconsideration of the land allocation programmes were issues confronting the sector. The economic crisis has added a level of complexity to these “old” problems while contributing new pressures and opportunities for agriculture.
With its slow growth and shrinking relative role in the Malaysian economy, agriculture had often been referred to as a “sunset industry”. The financial crisis, however, has changed that perspective. Agriculture’s enhanced export performance can play a significant role in reducing the impact of the economic downturn and it will certainly have a major part in the country’s economic recovery. Compared with manufactured goods, agricultural exports rely less on imported inputs. Therefore, the sector’s comparative advantage should benefit from the currency devaluation. Considering also the increase in palm oil and cocoa prices in dollar terms since mid-1997 (and even in ringgit terms since the currency devaluation), the export component of the sector can be seen as a bright spot in an economy plagued with a growing number of layoffs and company closures.
There is a danger that policy imperatives at the national level could introduce
new pressures that will have severe detrimental effects on other parts of the sector,
namely the food economy. Government measures taken to hold down food price increases have
already put import-based domestic food industries in a bind. Caught between the rising
cost of imported raw material prices (e.g. animal feedstuffs, wheat, milk powder) and an
inability to raise product prices, many processors for the domestic market are facing
severe losses. If the crisis persists and the government does not allow food prices to
reflect the increase in the cost of imported raw materials, Malaysia’s domestic
food-processing industries will face a long and severe contraction. Malaysia-based
companies without extensive international operations will be the least capable of
surviving.
A balanced development approach has put Malaysia in a comparatively strong position to weather economic storms.
Malaysia has undergone a major transformation from being an economy based on the production and export of primary products to a growing, industrial and financial centre. Over the past three decades, Malaysia has continued to invest in and develop its agricultural base, even as it pursued policies to foster the growth of the industrial sector. This balanced development approach has put Malaysia in a much stronger position to weather economic storms. The period has also seen a significant improvement in the nutritional status of Malaysia’s population, only 7 percent of which is estimated to be undernourished today. This achievement has been made possible by the rapid growth in economic activity as well as in real incomes.
MALAYSIA: DOMESTIC SUPPLY AND UTILIZATION OF
CEREALS
Economic growth has also enabled the country to meet the growing food needs of the population through food imports which, while increasing steadily in volume and value, have corresponded to an ever-declining share of total merchandise export revenues (22 percent in the early 1970s, 13 percent in the early 1980s and about 5 percent in recent years). Thus, the issue of a large and growing food import dependence, which was a matter of concern in many other country circumstances, has not constituted a major economic problem or an obstacle to food security in Malaysia.
Nevertheless, the economic environment has changed significantly in the past
year. Along with other countries in Asia, Malaysia now faces a potentially severe and
protracted economic crisis. This points again to the importance of maintaining a balanced
approach to sectoral development, and one in which agriculture plays a proper role. This
means, in particular, adequately addressing the problems of disparity in productivity
between estates and smallholders and taking full advantage of the new opportunities that
may emerge in the agricultural export sector. The importance of labour markets responding
properly to economic opportunities has also been underlined. For these endeavours, a key
to prudent economic decisions will be to allow price signals unleashed by the crisis to
stimulate economic recovery – while also shielding the poorest and vulnerable
population groups from the impact of rising food prices.
![]()
![]()
![]()